Pixie uses eBPF to drive much of its data collection.
This approach enables Pixie to efficiently collect data in a way that requires no user instrumentation
(i.e. no code changes, no redeployments).
Pixie sets up eBPF probes to trigger on a number of kernel or user-space events.
Each time a probe triggers, Pixie collects the data of interest from the event.
This enables Pixie to automatically collect monitoring data such as various protocol messages.
The following sections further describe how Pixie uses eBPF in some of its key features.
Protocol Tracing
One of the main features of Pixie is its ability to automatically trace protocol messages.
When Pixie is deployed to the nodes in your cluster, it deploys eBPF kernel probes (kprobes) that are set up to trigger
on Linux syscalls used for networking. Then, when your application makes network-related syscalls -- such as send() and recv() --
Pixie's eBPF probes snoop the data and send it to the Pixie Edge Module (PEM).
In the PEM, the data is parsed according the detected protocol and stored for querying.
Pixie Protocol Tracing with eBPF
Tracing TLS/SSL Connections
Pixie's SSL tracing works in a similar way as its basic protocol tracing, with one main difference:
Instead of using eBPF to snoop the data at send() and recv(), eBPF user-space probes (uprobes)
are set up directly on the TLS library's API. This enables Pixie to capture the data before it is encrypted.
Pixie supports several encryption libraries,
including OpenSSL.
Pixie TLS/SSL Protocol Tracing with eBPF
Application CPU Profiling
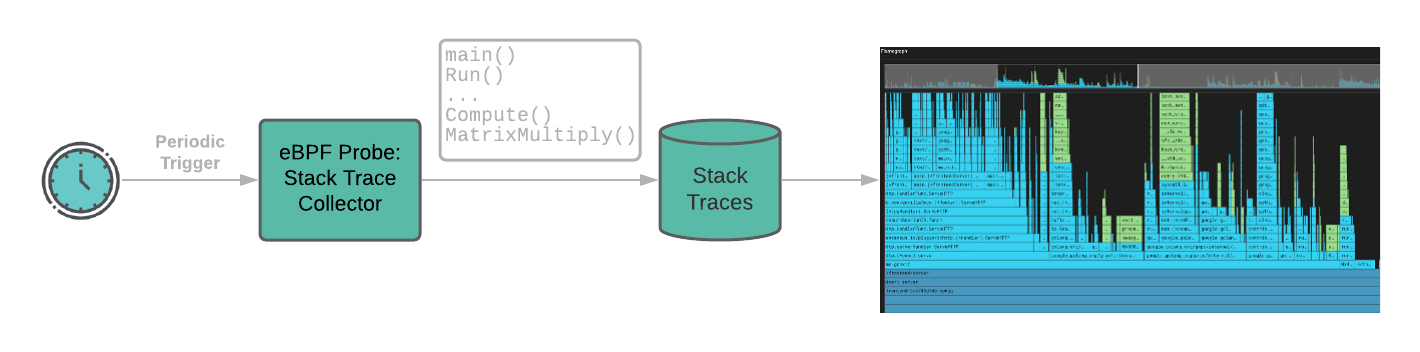
Pixie's continuous profiler uses eBPF to periodically interrupt the CPU. During this process, the eBPF probe
inspects the currently running program and collects a stack trace to record where the program was executing.
This approach to CPU profiling is called a sampling-based profiler. By only triggering at a very low frequency
(approximately once every 10 ms), the overhead is negligible. The sampling rate, however, is sufficient
to identify the applications that are using the CPU the most, and which parts of the code is typically being executed.
Application CPU Profiling with eBPF
To learn more about how we built Pixie's eBPF-based continuous profiler, see the blog post.
Distributed bpftrace Scripts
eBPF is also used in Pixie's distributed bpftrace script deployment.
In this case, you can write your own custom BPF code, using the bpftrace format. Pixie orchestrates the
deployment of the BPF code to all the nodes in your cluster and records the results in a structured way into its data tables.
Dynamic Logging
With Pixie's dynamic logging feature (currently supported for Golang), you specify a function in your
deployed code that you'd like to inspect. Pixie then automatically generates the eBPF code for tracing the
specified arguments and return values of the function. Once deployed, the auto-generated eBPF probe triggers
every time the function is called, and the arguments and return values are recorded into a table which can be queried.
This enables the application developer to effectively add logs to their running programs without ever recompiling or
redeploying!