EXPAND ALL
- Home
- About Pixie
- Installing Pixie
- Using Pixie
- Tutorials
- Reference

This tutorial will demonstrate how to use Pixie's Always-On Profiling feature to investigate a spike in CPU utilization, using a flamegraph to identify a performance issue within the application code.
Pixie's continuous profiler currently supports Go, C++, Rust and Java. For best results, run Java applications with -XX:+PreserveFramePointer. Other language support coming soon.
You will need a Kubernetes cluster with Pixie installed. If you do not have a cluster, you can create a minikube cluster and install Pixie using one of our install guides.
Support for Java profiling is included by default in Pixie.
For best results, run Java applications with -XX:+PreserveFramePointer.
We are going to be working with GCP's Online Boutique, a microservices demo application for a web-based e-commerce app where users can browse and purchase items.
px-online-boutique running on your cluster, please re-deploy, as recent modifications have been made to this demo.px demo deploy px-online-boutique
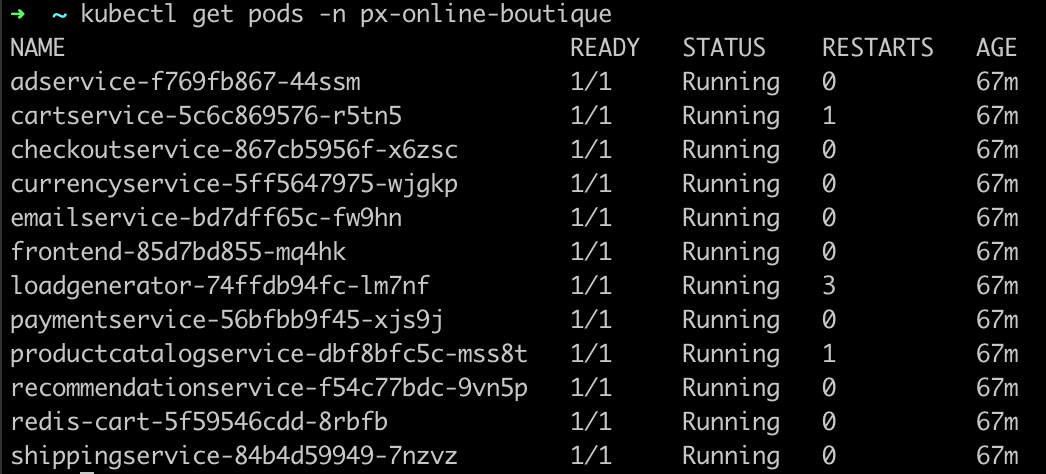
kubectl get pods -n px-online-boutique
You should see something similar to the following:
We are going to use Pixie to check the health of a specific pod.
Open Pixie's Live UI
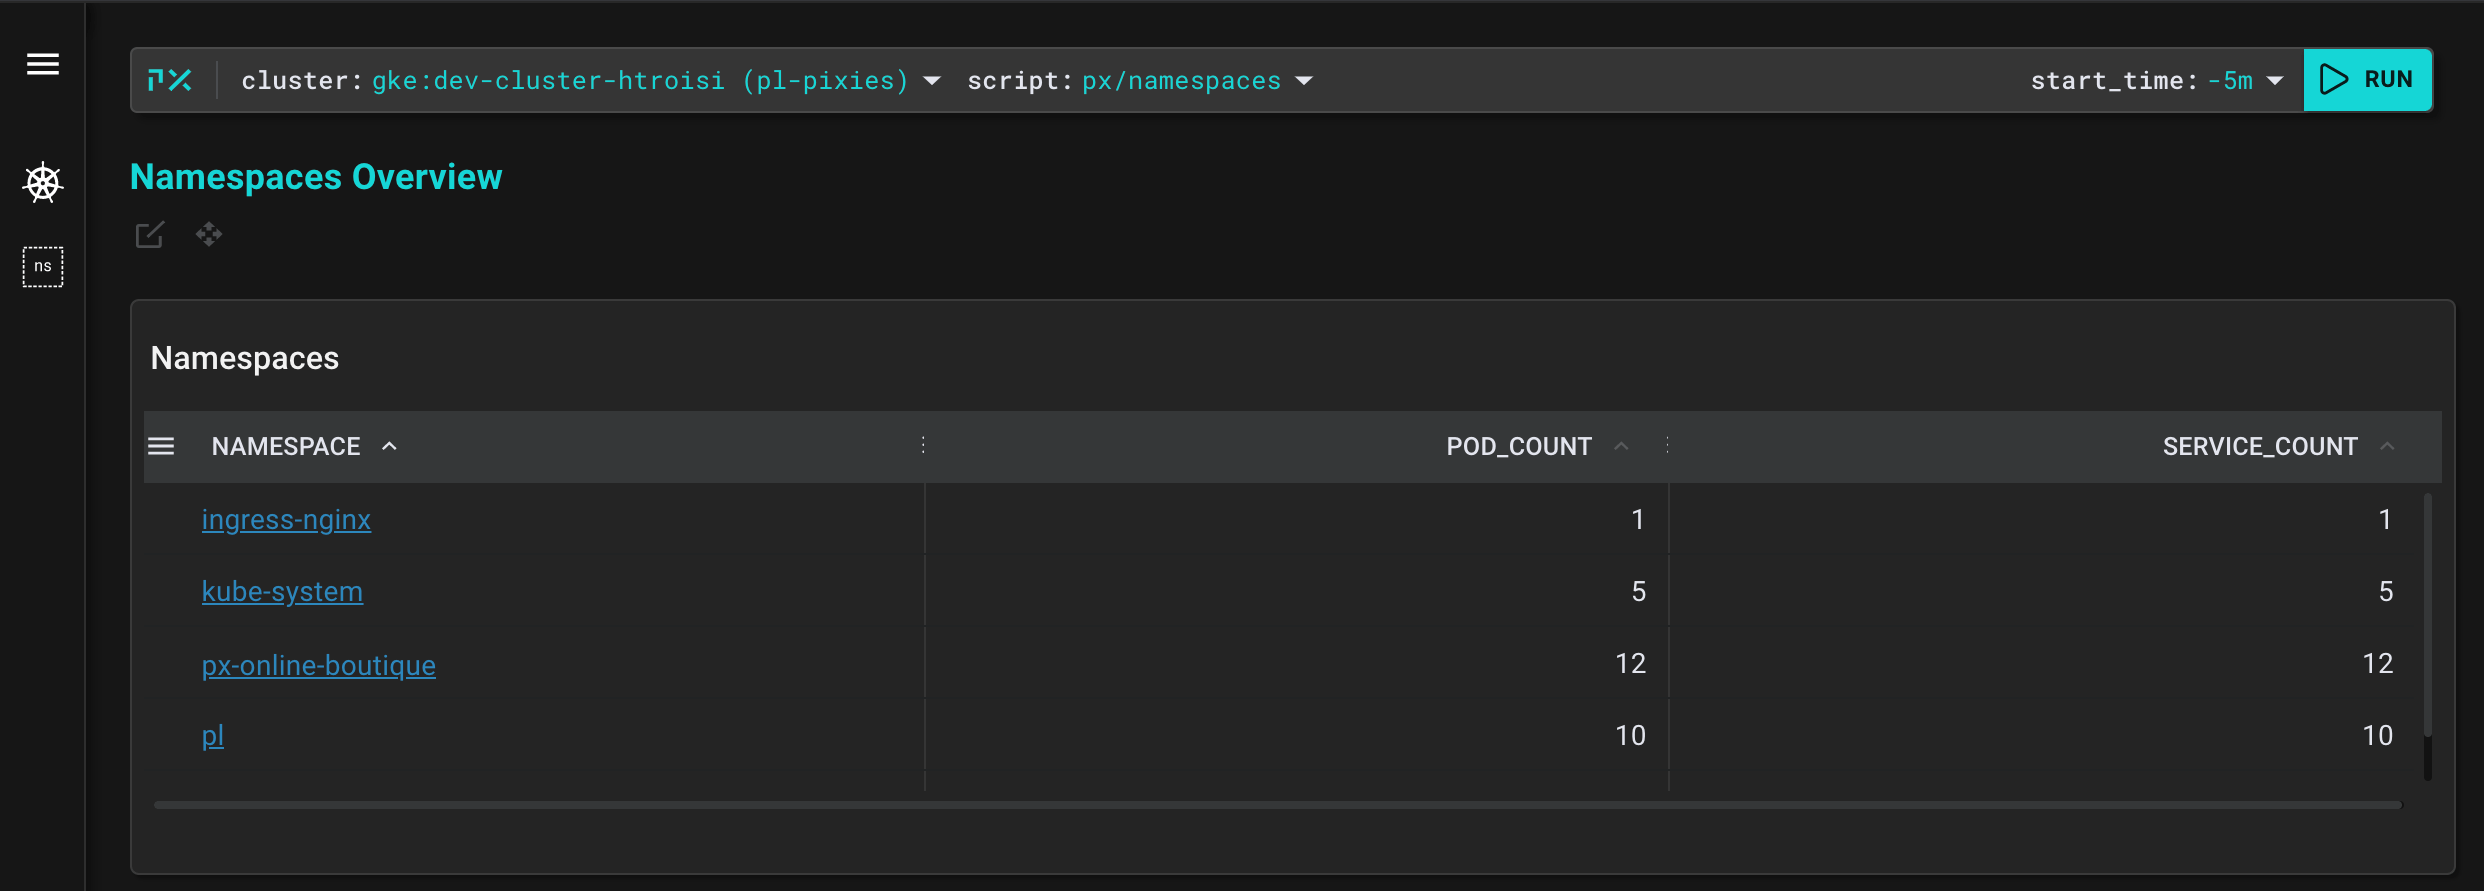
Select your cluster and the px/namespaces script from the drop-down menus in the top bar.
The px/namespaces script lists the namespaces on the current cluster with their pod and service counts. You should see both Pixie's namespace (pl) as well as the Online Boutique namespace (px-online-boutique).
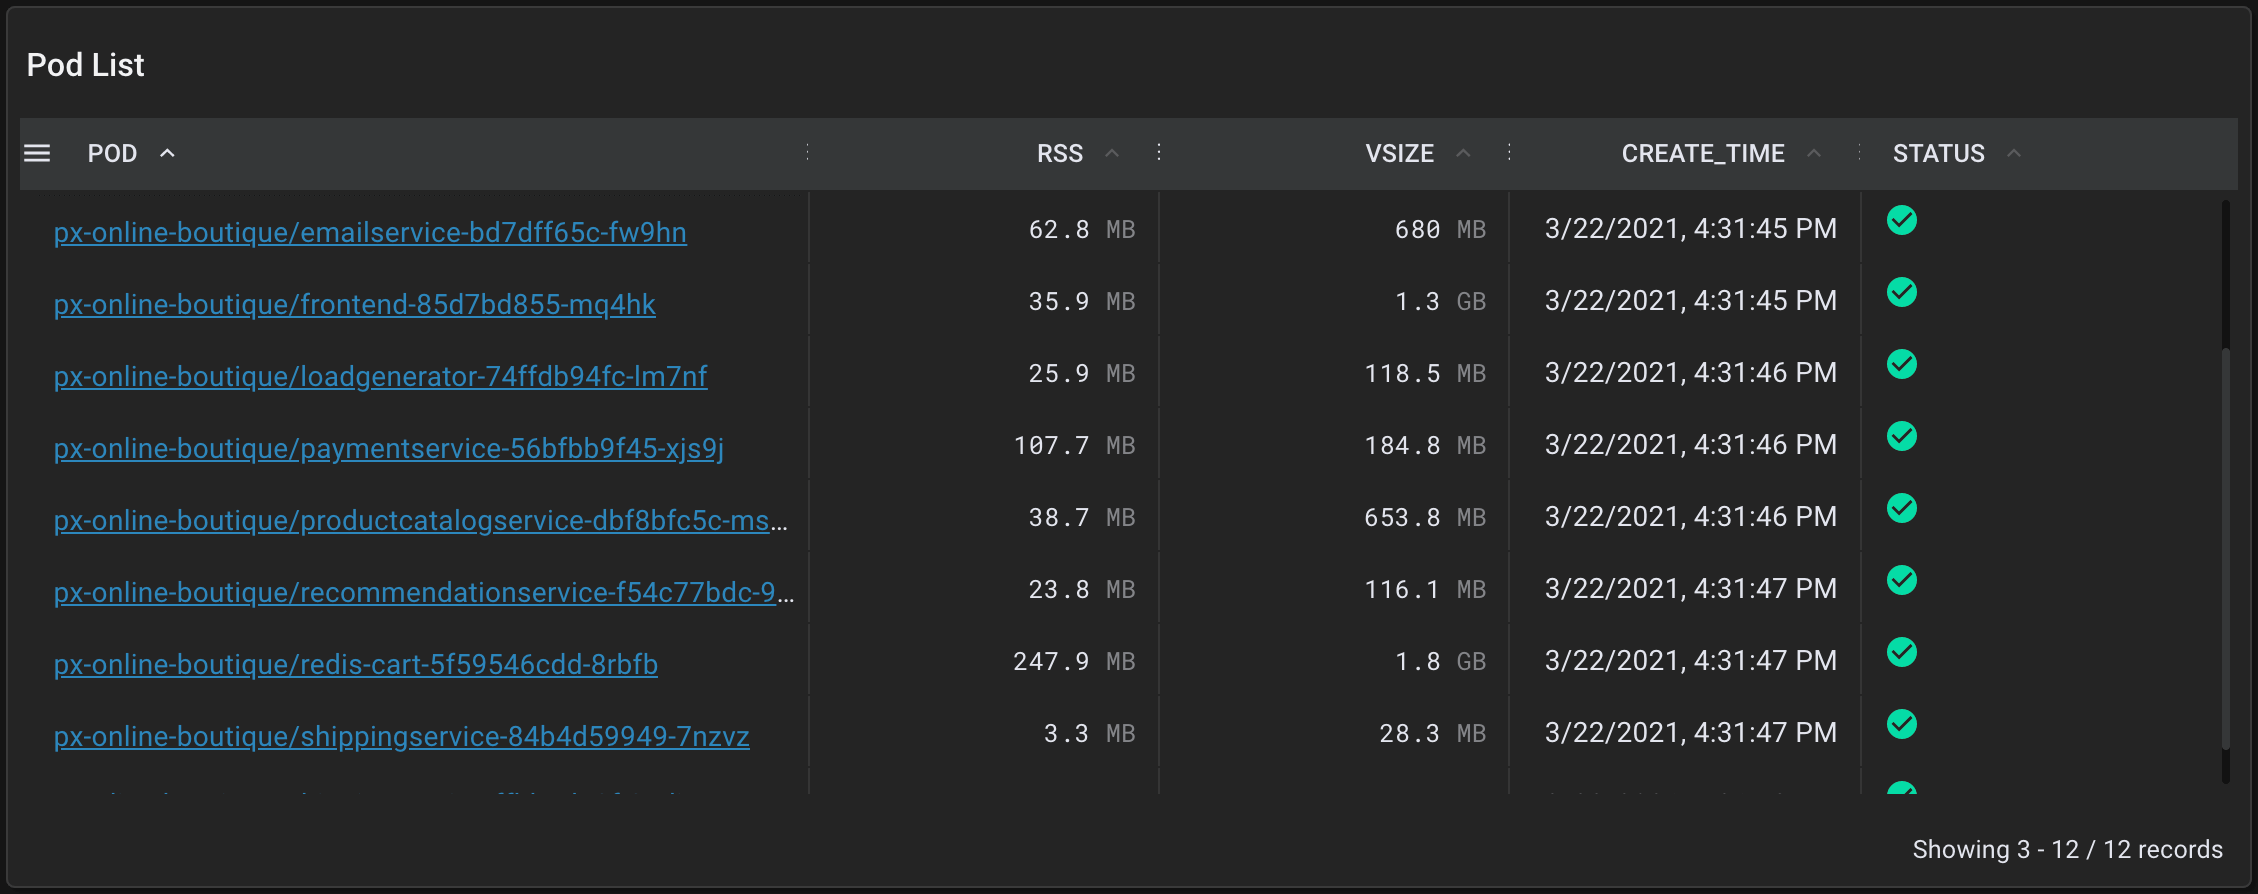
px-online-boutique in the list of namespaces to be taken to the px/namespace script.This script lists the services and pods within the selected namespace.
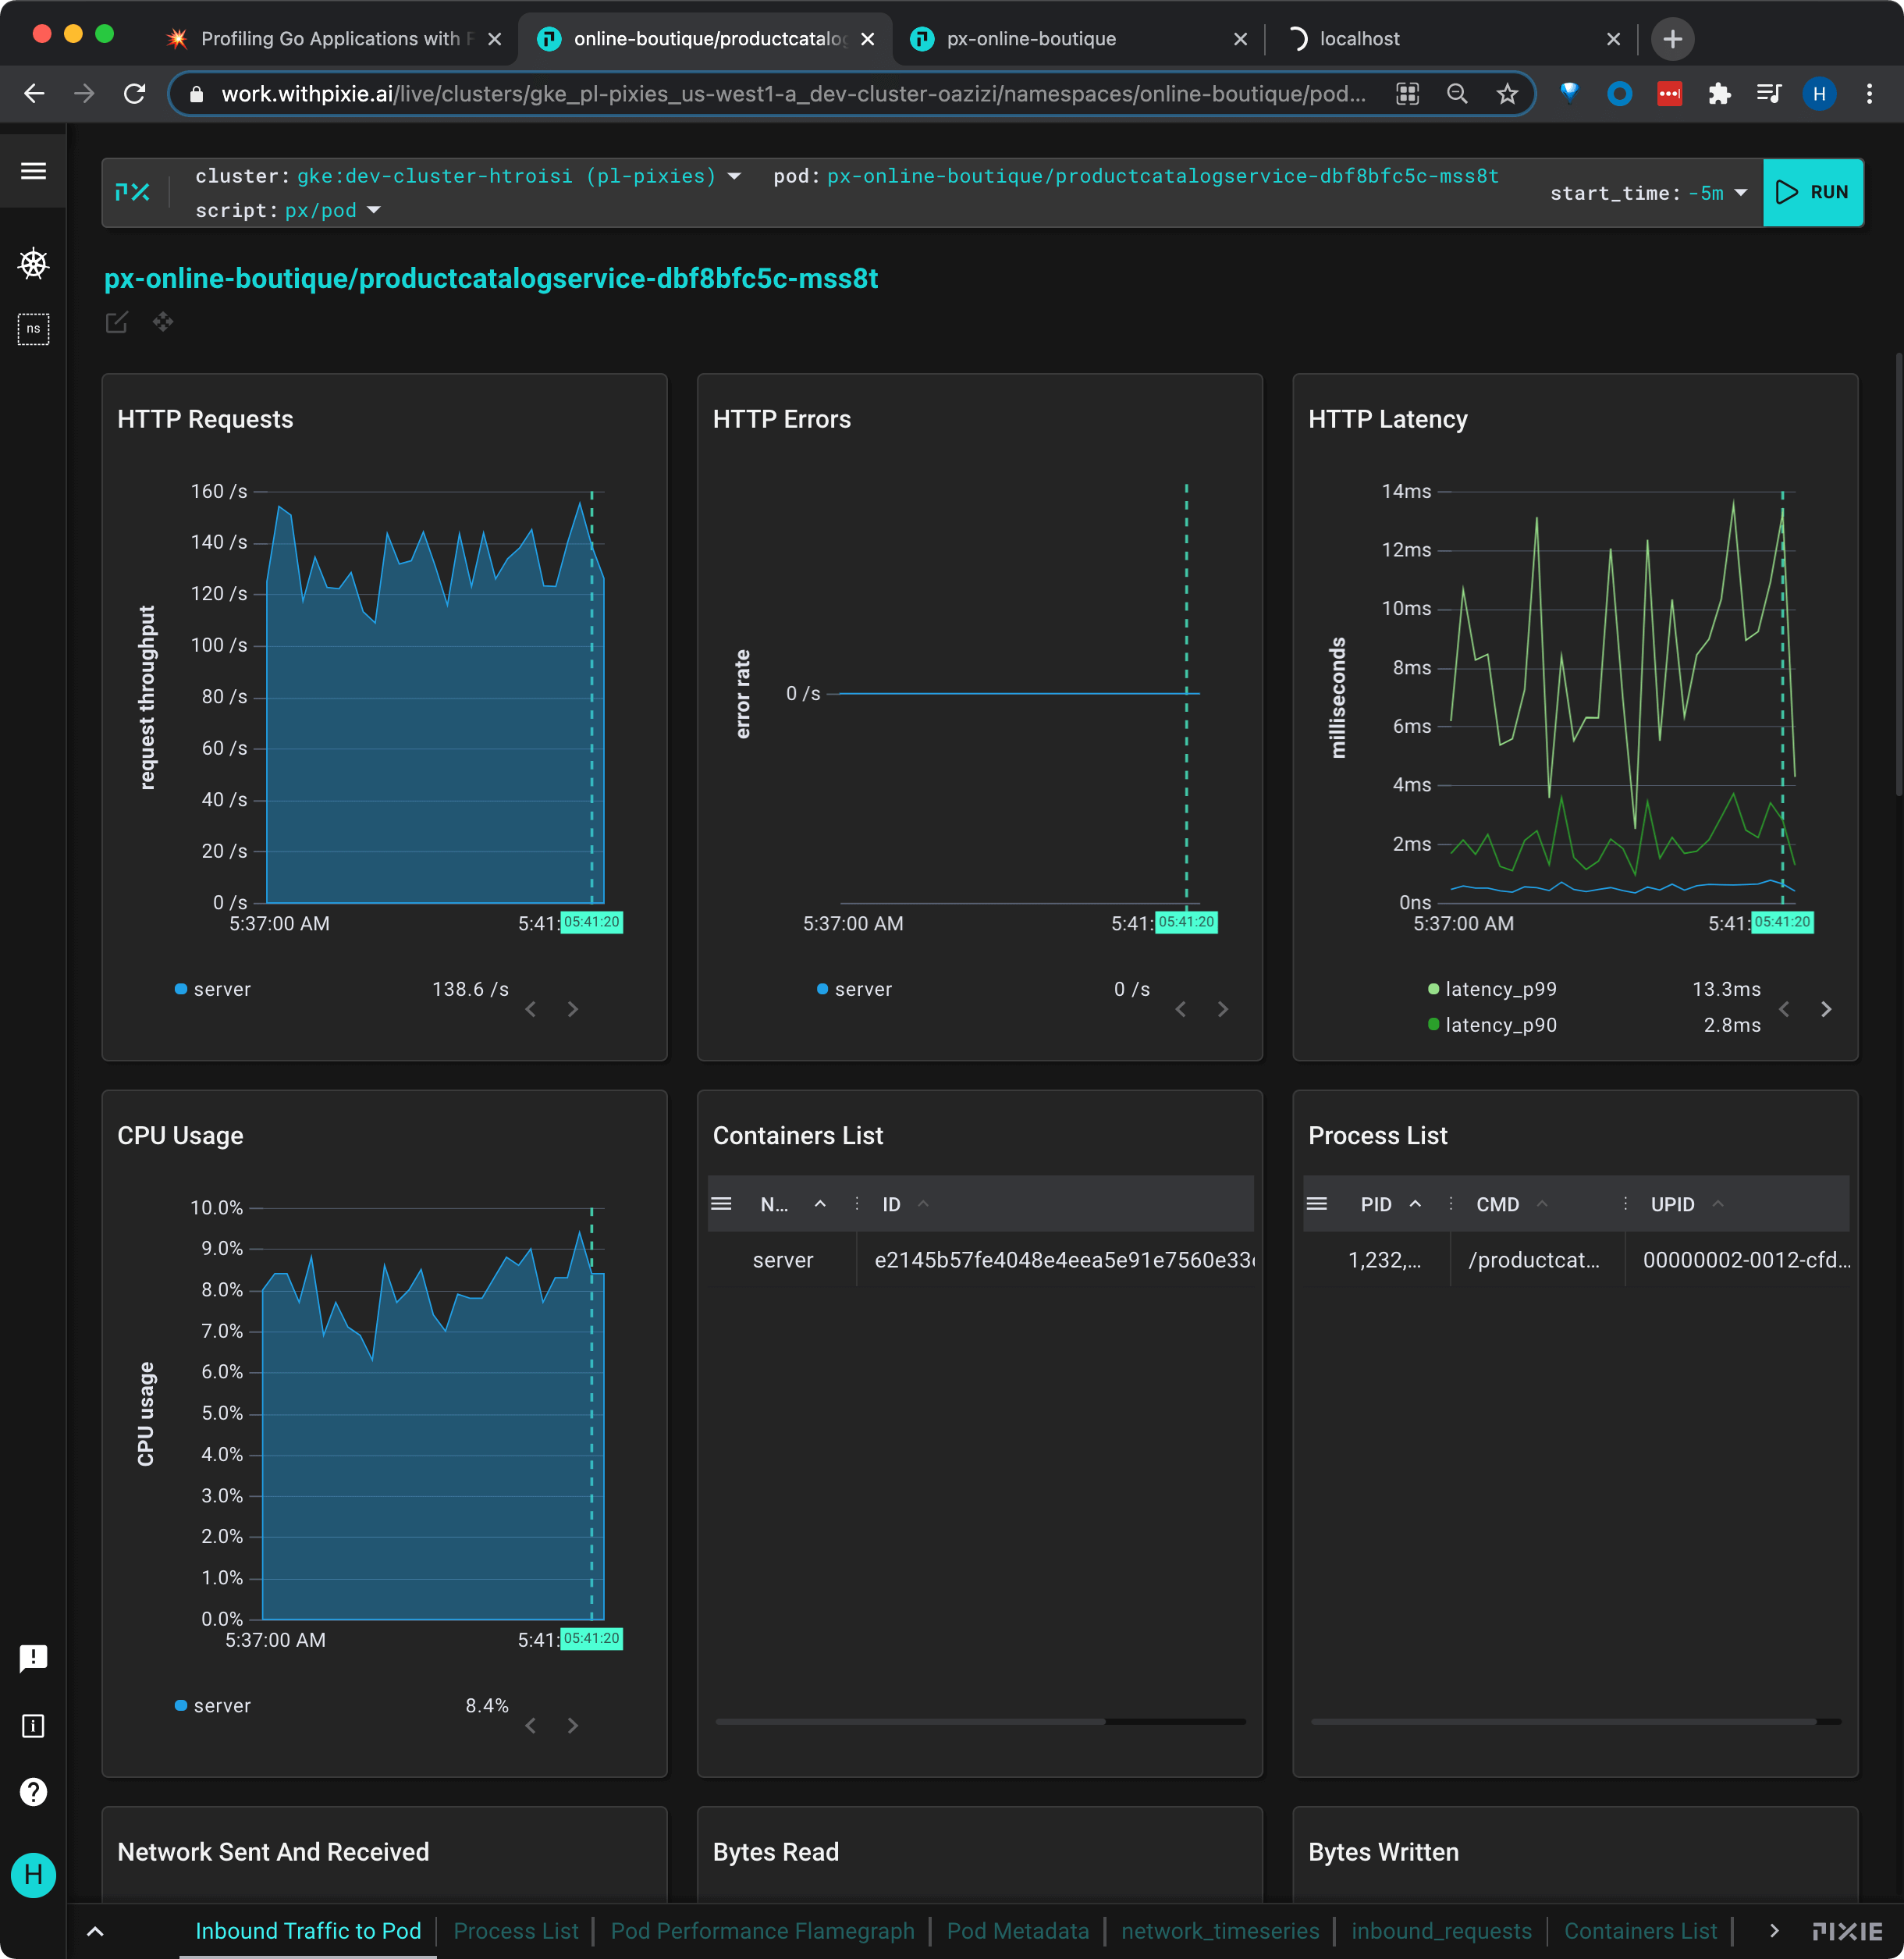
px-online-boutique/poductcatalogservice-... pod.Selecting the pod name takes us to the px/pod script which shows an overview of the high level application metrics (latency, error, throughput) and resource utilization for the selected pod. This pod's metrics look normal based on our knowledge of the app.
Our friends on the Product Catalog team have built a feature to dynamically reload the product catalog. Let's help them turn on this new feature.
productcatalogservice pod:kubectl exec -n px-online-boutique \$(kubectl get pods -n px-online-boutique -l app=productcatalogservice -o jsonpath='{.items[0].metadata.name}') \-c server -- kill -USR1 1
px/pod script using the RUN button in the top right.This chart shows some concerning information. Our HTTP throughput has plummeted from ~140 rps to ~10 rps ("HTTP Requests" graph), the request latency has spiked to 16s ("HTTP Latency" graph), and our CPU usage has spiked from ~8% to ~18% ("CPU Usage" graph).
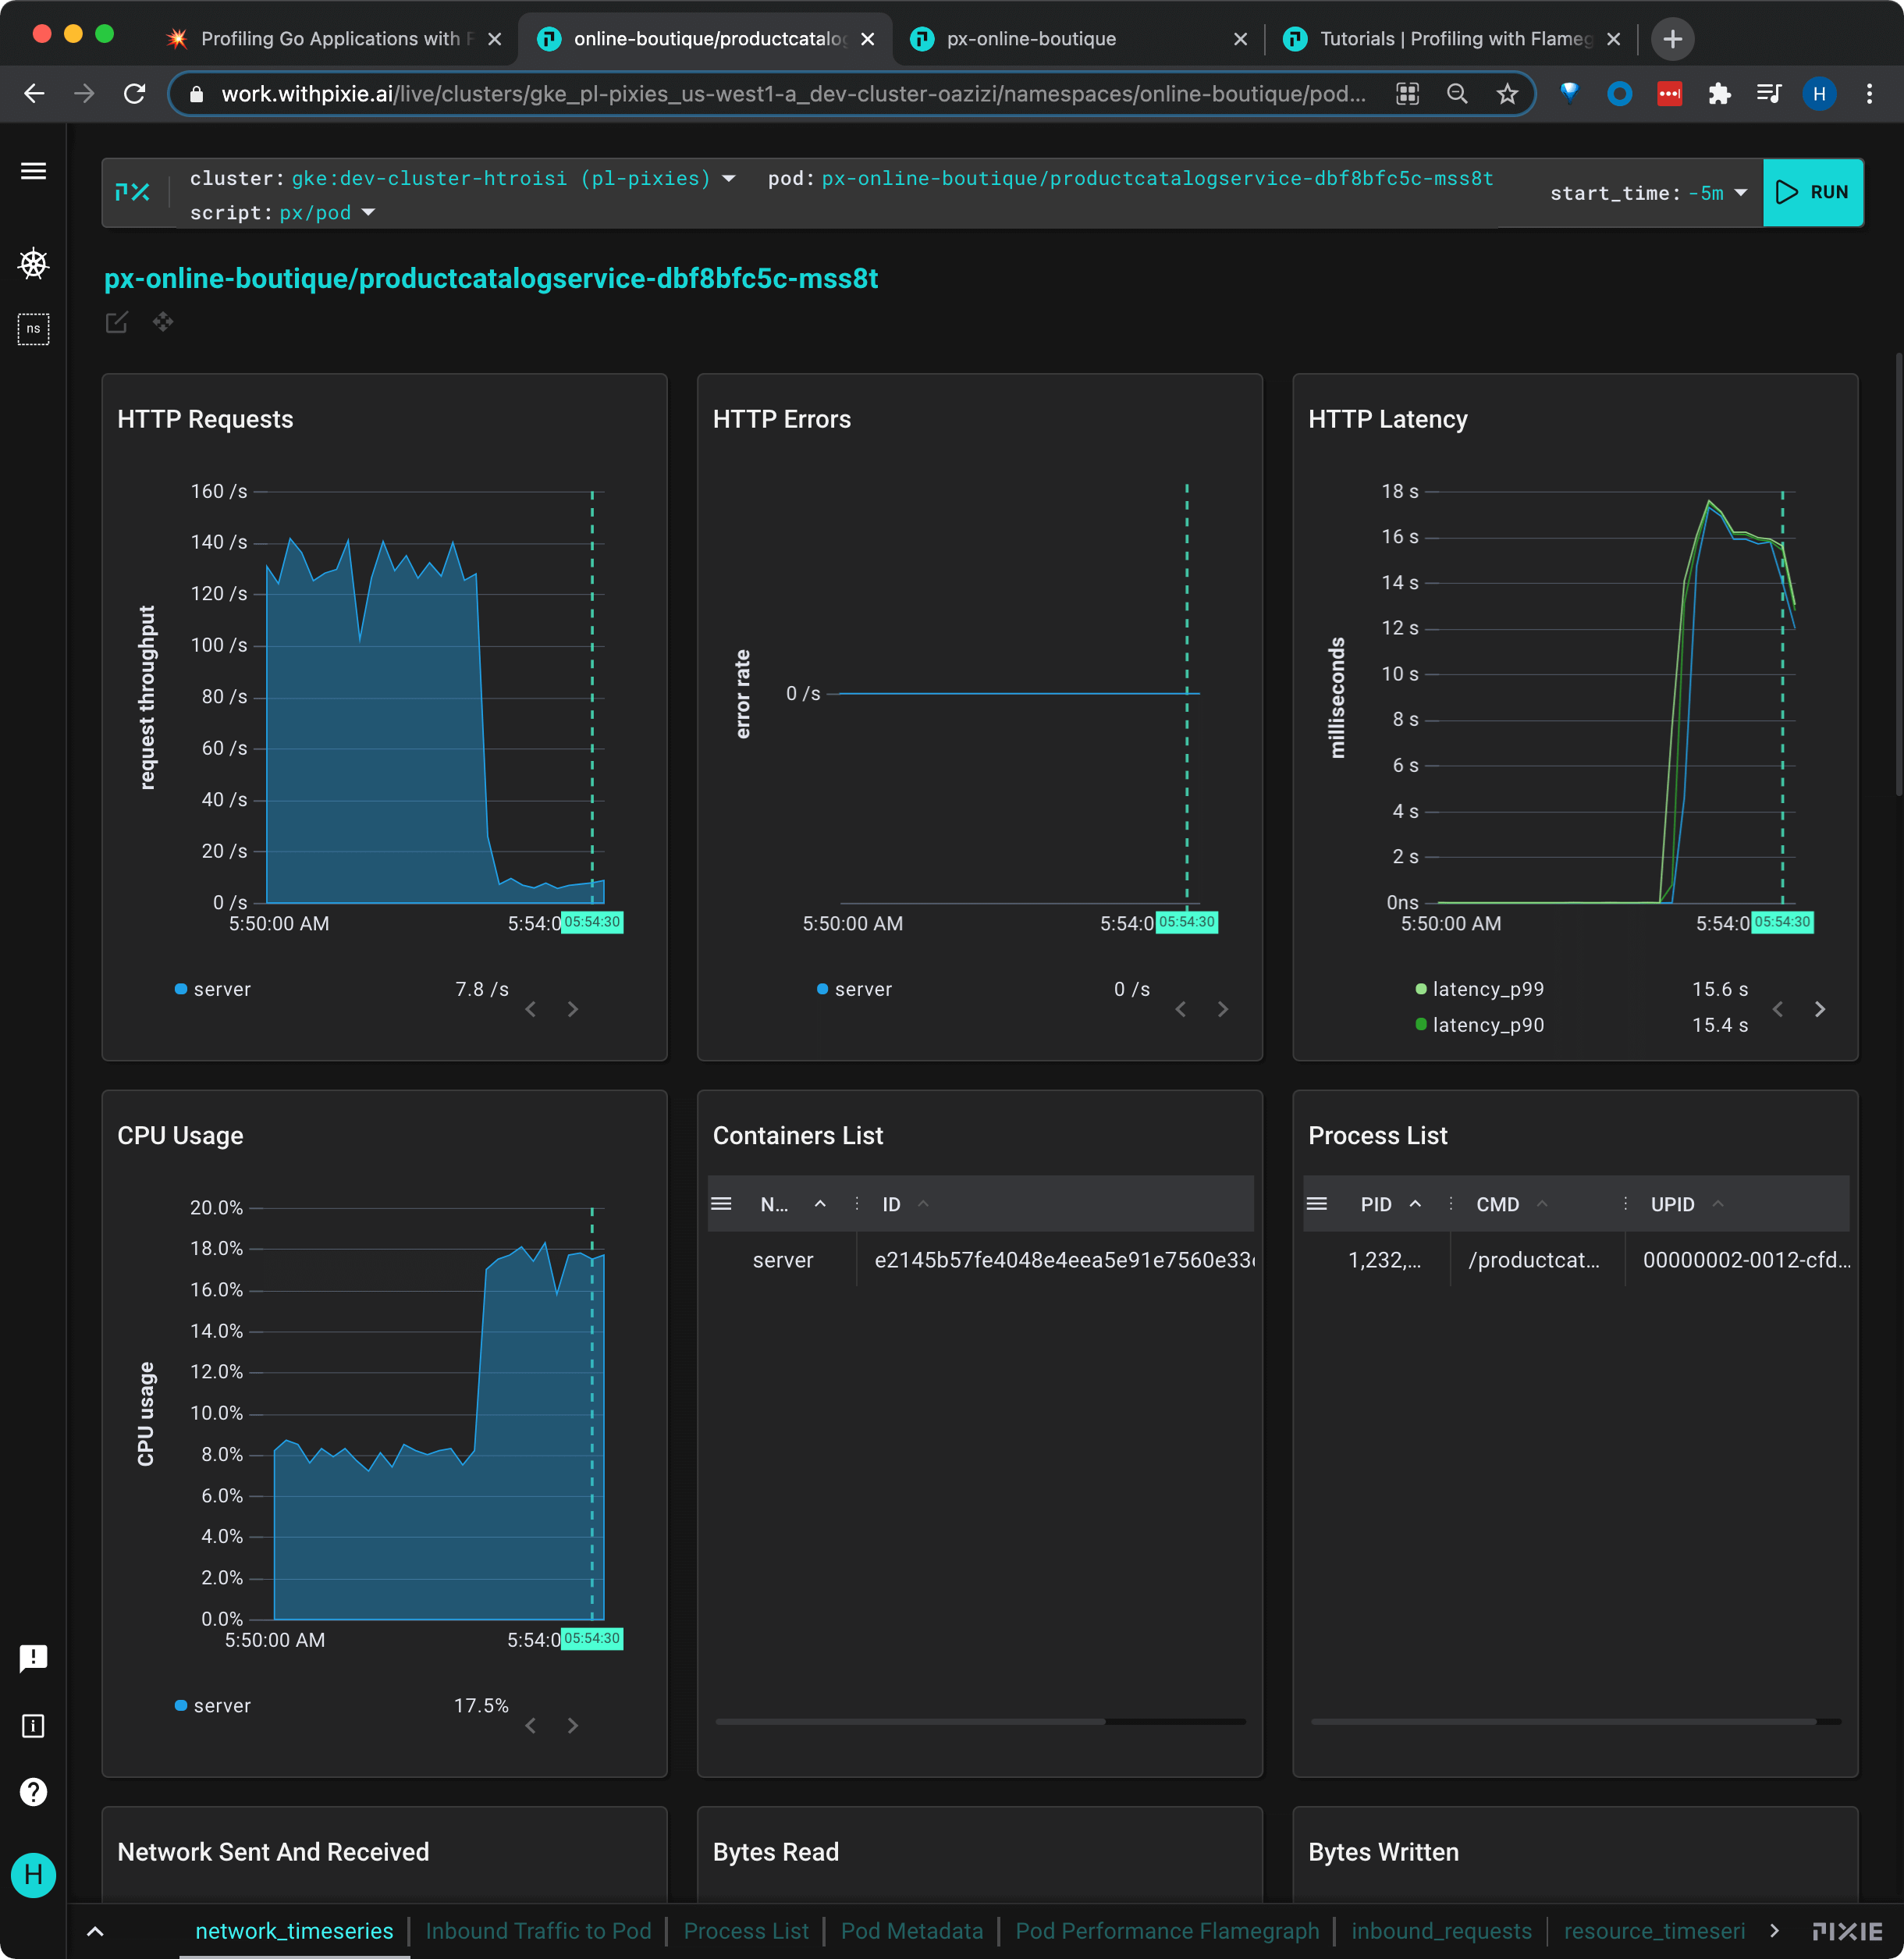
Note: if your graph does not show similar changes to those shown above, try waiting another minute and re-running the script.
Let's take a look at the flamegraph for this pod and see if it can help us identify the root cause of this performance issue.
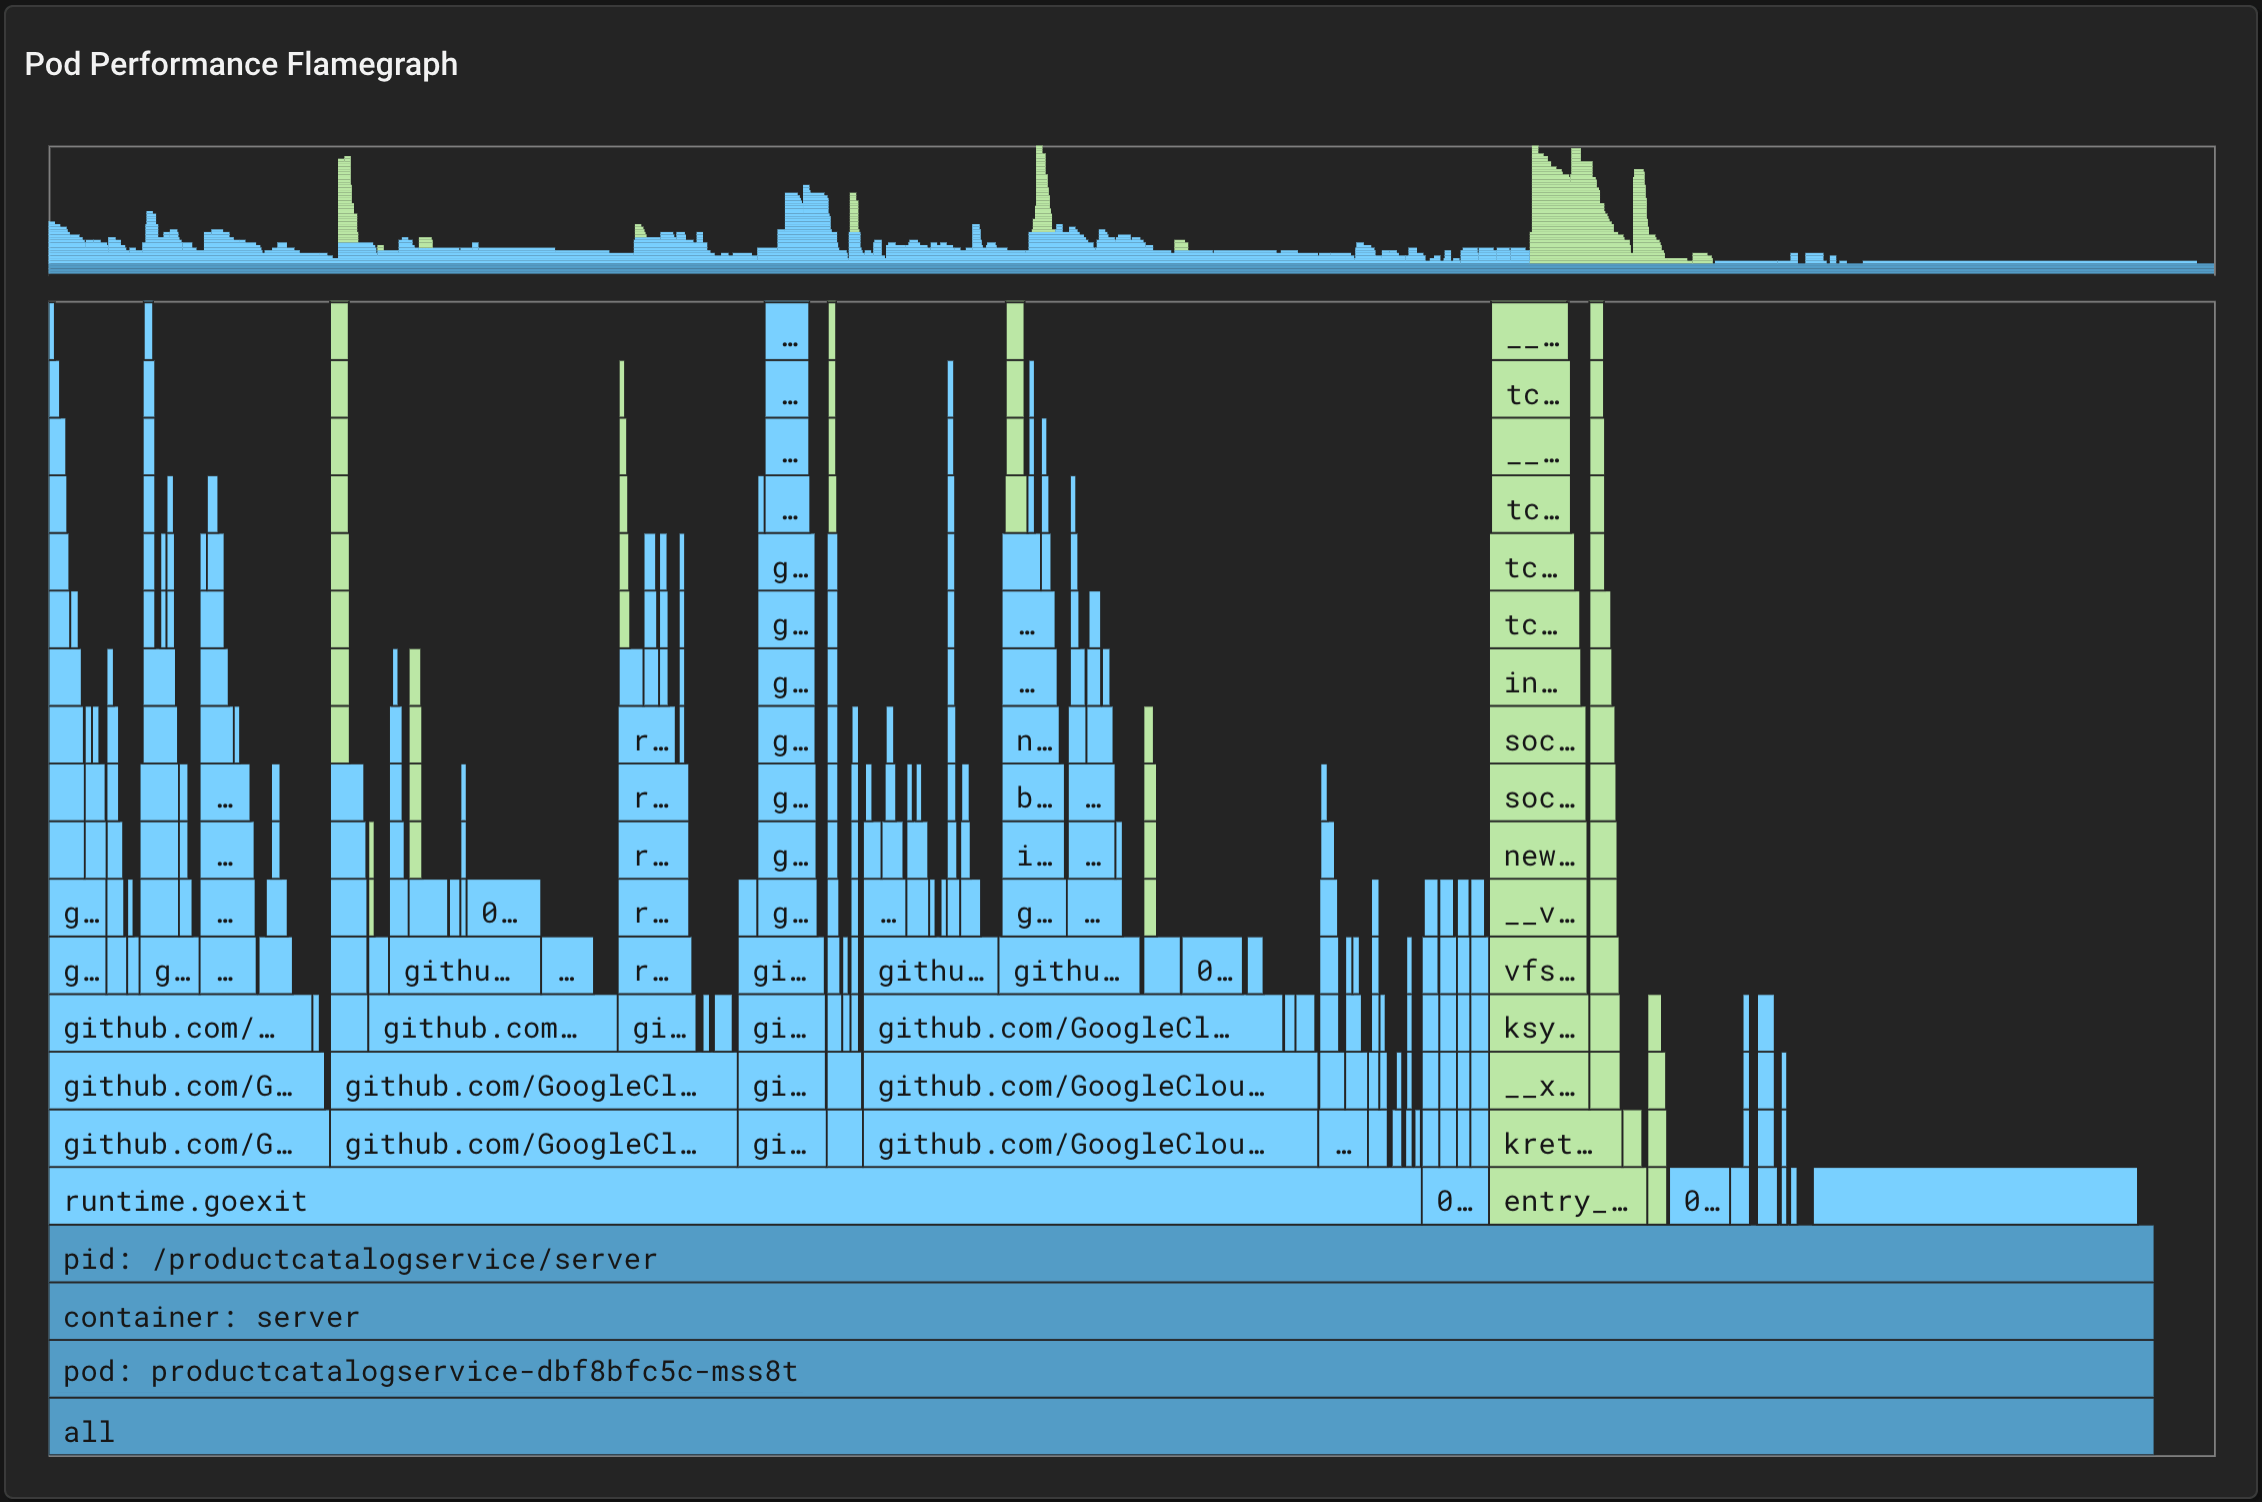
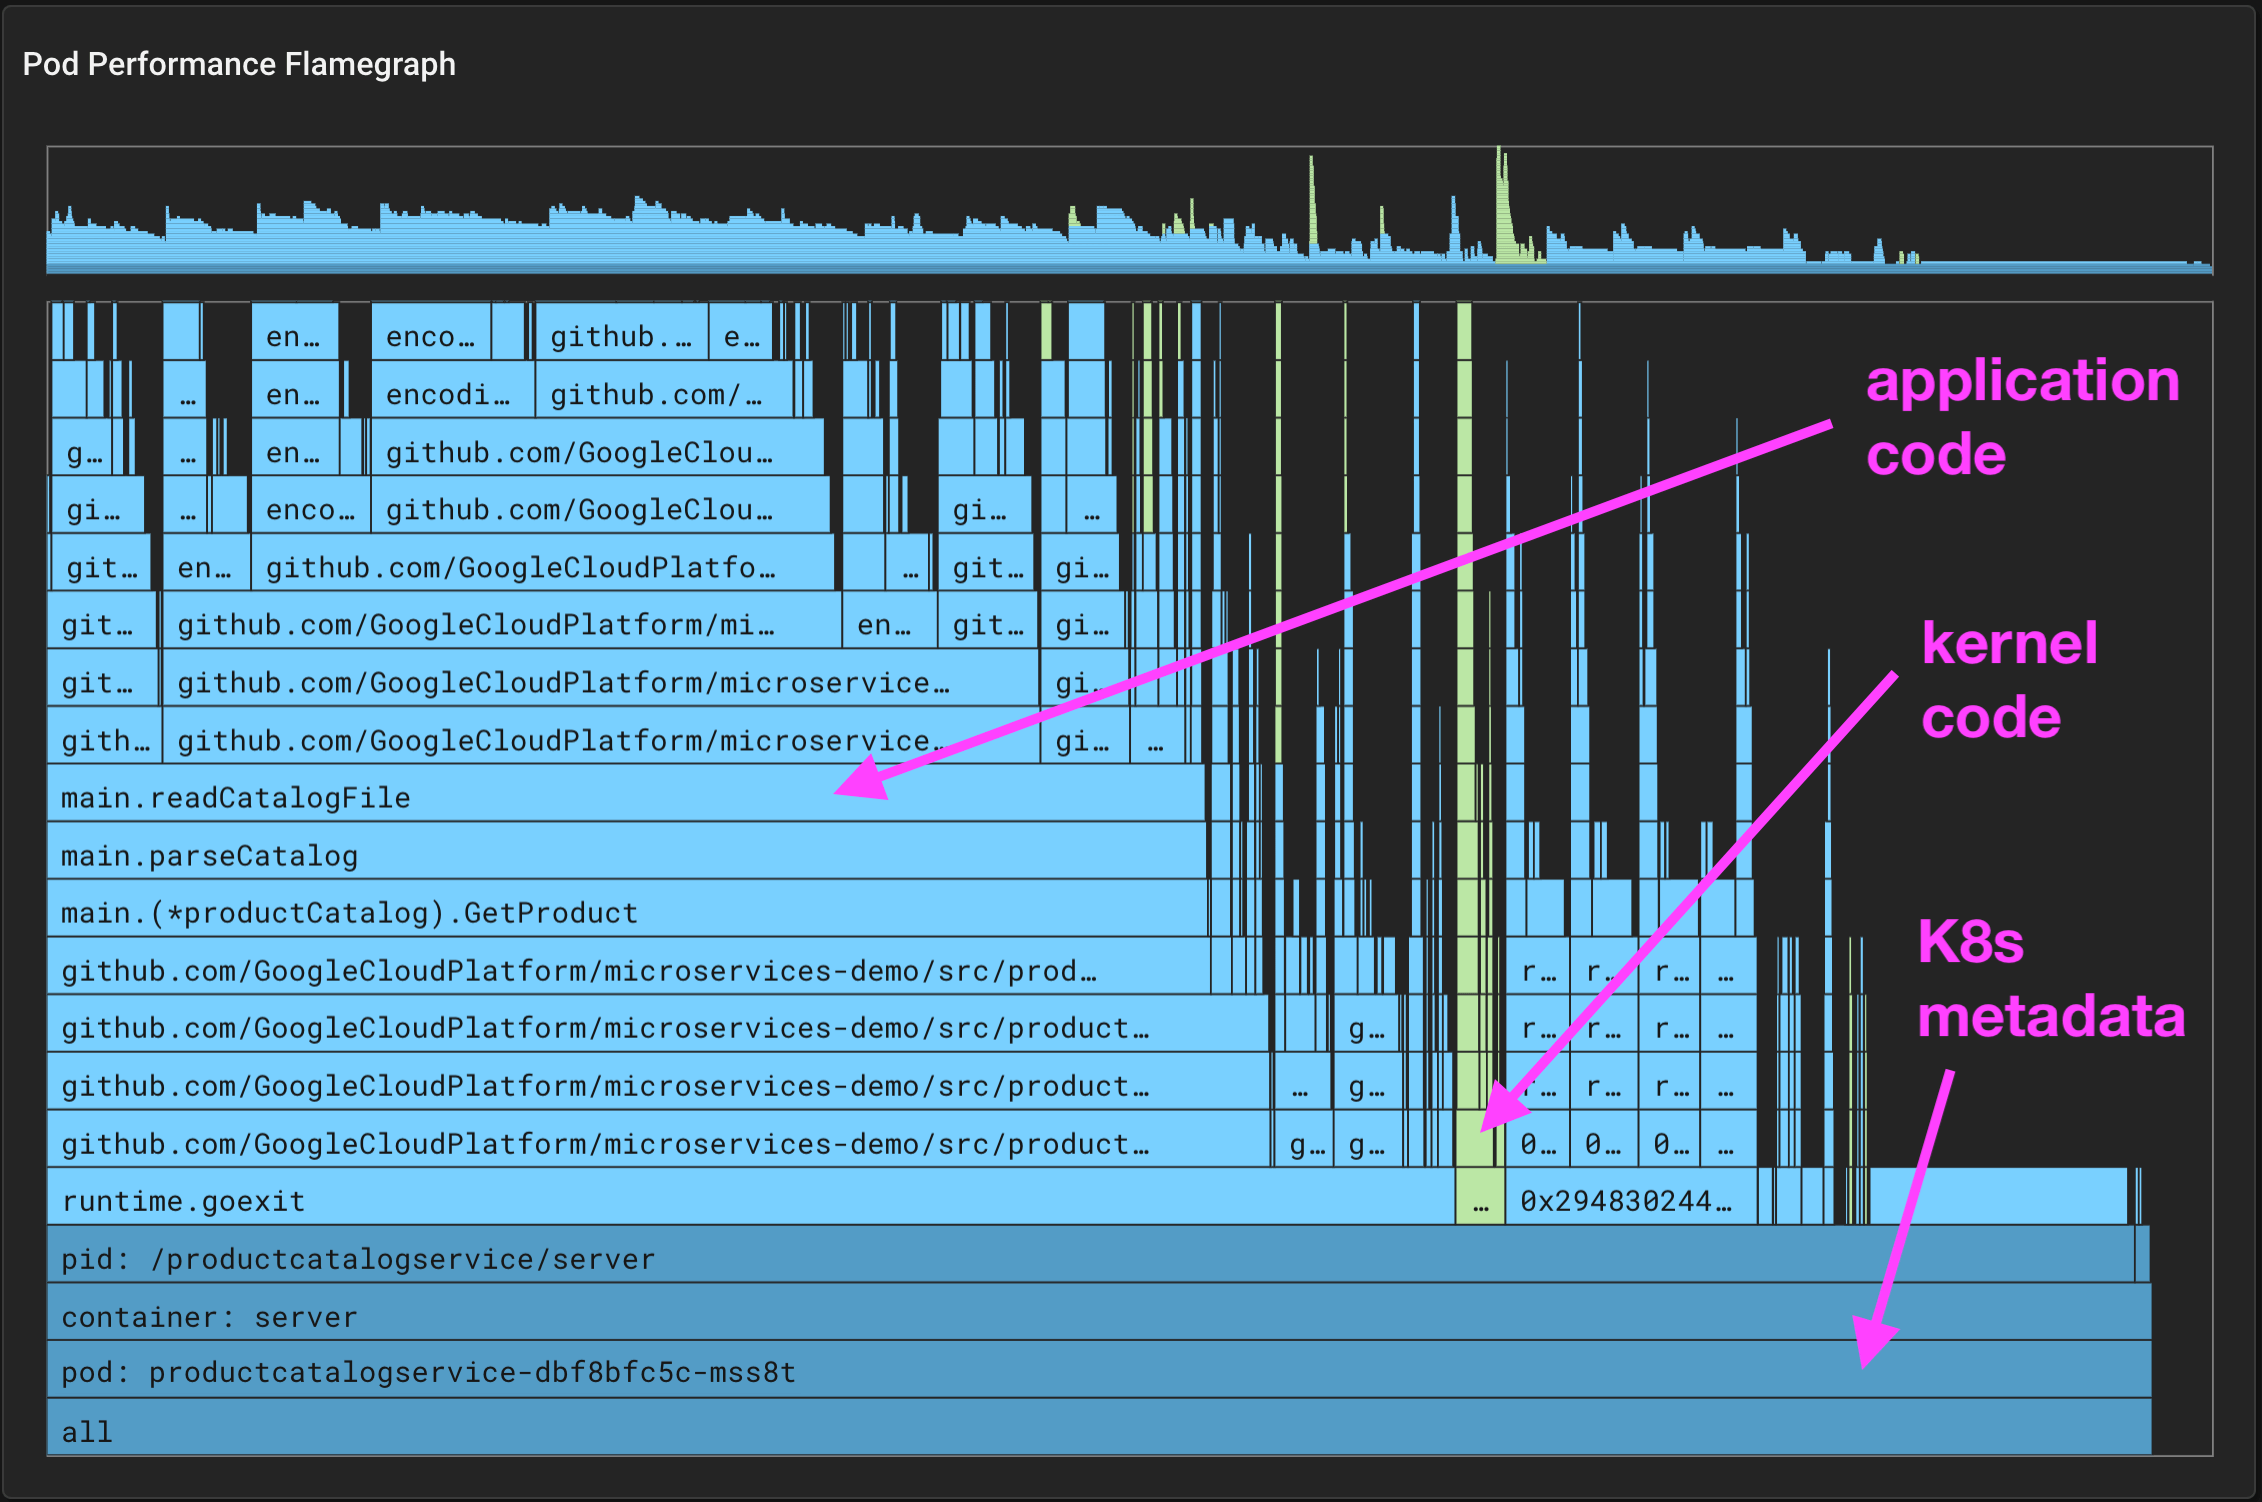
Scroll down to the bottom of the px/pod page, to take a look at the "Pod Performance Flamegraph".

Every ~10ms, the Pixie profiler samples the current stack trace on each CPU. The stack trace includes the function that was executing at the time of the sample, along with the ancestor functions that were called to get to this point in the code.
The collected samples are aggregated across a larger 30 second window that includes thousands of stack traces. These stack traces are then grouped by their common ancestors. At any level, the wider the stack, the more often that function appeared in the stack traces. Wider stack traces are typically of more interest as it indicates a significant amount of the application time being spent in that function.
The background color of each box in the flamegraph adds an extra dimension of data:
You can interact with Pixie's flamegraph widget in the following ways:
ctrl (Linux, Windows) / cmd (Mac) + click to center the view on the selected element. Click on the bottom most bar to reset the zoom.Starting at the base of the application code (light blue), hover over the widest bar to read the function names and percentage of time spent in each function.
Working our way up the stack, we see that the ProductHandler() calls GetProduct(), which calls parseCatalog(), which in turn calls readCatalogFile(), which make calls to a JSON reader.
It certainly seems odd that we should be reading the catalog's json file every time we get a product.
Note: if your flamegraph does not show a very wide stack that includes the parseCatalog() function, try waiting another minute and re-running the script.
Let's take a look at the productcatalog application code. parseCatalog() only calls readCatalogFile() if the reloadCatalog flag is set or if the catalog is empty.
func parseCatalog() []*pb.Product {if reloadCatalog || len(cat.Products) == 0 {err := readCatalogFile(&cat)if err != nil {return []*pb.Product{}}}return cat.Products}
Looking elsewhere in the code, we see that the reloadCatalog flag was set when we sent a USR1 signal to enable the catalog reloading feature.
sigs := make(chan os.Signal, 1)signal.Notify(sigs, syscall.SIGUSR1, syscall.SIGUSR2)go func() {for {sig := <-sigslog.Printf("Received signal: %s", sig)if sig == syscall.SIGUSR1 {reloadCatalog = truelog.Infof("Enable catalog reloading")} else {reloadCatalog = falselog.Infof("Disable catalog reloading")}}}()
The developers of this code have created a buggy feature - the reloadCatalog flag is not getting set to false after a reload. Instead, the catalog is read from file every single time the catalog is accessed.
To turn off the buggy "dynamic catalog reloading" feature, send a USR2 signal:
kubectl exec -n px-online-boutique \$(kubectl get pods -n px-online-boutique -l app=productcatalogservice -o jsonpath='{.items[0].metadata.name}') \-c server -- kill -USR2 1
Change the start_time script argument (next to the RUN button) to -1m and re-run the script.
You should see CPU usage drop and HTTP request throughput increase. Scroll down to the flamegraph at the bottom of the page and you should see that considerably less time is spent in the parseCatalog() function. This "flame" on the graph is now much more narrow.