This page describes how to troubleshoot Pixie. We frequently answer questions on our community Slack channel and in response to GitHub issues. You can also check those two places to see if your question has already been addressed. To better understand how Pixie's various components interact, please see the Architecture overview.
Cloud components can be checked by running kubectl get pods -n plc.
How do I get the Pixie debug logs?
Install Pixie’s CLI tool and run px collect-logs. This command will output a zipped file named pixie_logs_<datestamp>.zip in the working directory. The selected kube-context determines the Kubernetes cluster that outputs the logs, so make sure that you are pointing to the correct cluster.
My deployment is stuck / fails
We recommend running through the following troubleshooting flow to determine where the deployment has failed.
Troubleshooting the Deployment of Pixie
Deploy with CLI gets stuck at “Wait for PEMs/Kelvin”
This step of the deployment waits for the newly deployed Pixie PEM pods to become ready and available. This step can take several minutes.
If some vizier-pem pods are not ready, use kubectl to check the individual pod’s events or check Pixie’s debug logs (which also include pod events).
If pods are still stuck in pending, but there are no Pixie specific errors, check that there is no resource pressure (memory, CPU) on the cluster.
Deploy with CLI fails to pass health checks.
This step of the deployment checks that the vizier-cloud-connector pod can successfully run a query on the kelvin pod. These queries are brokered by the vizer-query-broker pod. To debug a failing health check, check the Pixie debug logs for those pods for specific errors.
Deploy with CLI fails waiting for the Cloud Connector to come online.
This step of the deployment checks that the Cloud Connector can successfully communicate with Pixie Cloud. To debug this step, check the Pixie debug logs for the vizier-cloud-connector pod, check the firewall, etc.
Why does my cluster show as unavailable / unhealthy in the Live UI?
Confirm that all of the pl and px-operator namespace pods are ready and available using px debug pods. Deploying Pixie usually takes anywhere between 5-7 minutes. Once Pixie is deployed, it can take a few minutes for the UI to show that the cluster is healthy.
To debug, follow the steps in the “Deploy with CLI fails to pass health checks” section in the above question. As long as the Kelvin pod, plus at least one PEM pod is up and running, then your cluster should not show as unavailable.
Troubleshooting Operation
Why does my cluster show as disconnected in the Live UI?
Cluster '<CLUSTER_NAME>' is disconnected. Pixie instrumentation on 'CLUSTER_NAME' is disconnected. Please redeploy Pixie to the cluster or choose another cluster.
This error indicates that the vizier-cloud-connector pod is not able to connect to the cloud properly. To debug, check the events / logs for the vizier-cloud-connector pod. Note that after deploying Pixie, it can take a few minutes for the UI to show the cluster as available.
Why can’t I see data?
Live UI shows an error.
Error Table 'http_events' not found is usually an issue with deploying Pixie onto nodes with unsupported kernel versions. Check that your kernel version is supported here.
Error Invalid Vis Spec: Missing value for required arg service. occurs when a script has a required argument that is missing a value. Required script arguments are denoted with an asterisk after the argument name. For example, px/service has a required variable for service name. Select the required argument drop-down box in the top left and enter a value.
Error Unexpected error rpc error: code = Unknown desc = rpc error: code = Canceled desc = context canceled is associated with a query timing out. Try reducing the start_time window.
Live UI does not show an error, but data is missing.
It is possible that you need to adjust the start_time window. The start_time window expects a negative relative time (e.g. -5m) or an absolute time in the format 2020-07-13 18:02:5.00 +0000.
If specific services / requests are missing, it is possible that Pixie doesn't support the encryption library used by that service. You can see the list of encryption libraries supported by Pixie here.
If specific services / requests are missing, it is possible that your application was not built with debug information. See the Data Sources page to see which protocols and/or encryption libraries require a build with debug information.
Why can’t I see application profiles / flamegraphs for my pod / node?
Pixie's continuous profiler currently supports Go, C++, Rust and Java. For best results, run Java applications with -XX:+PreserveFramePointer.
Why is the vizier-pem pod’s memory increasing?
This is expected behavior. Pixie stores the data it collects in-memory on the nodes in your cluster; data is not sent to any centralized backend cloud outside of the cluster. So what you are observing is simply the data that it is collecting.
When Pixie is first deployed, you can expect to see an increase in memory utilization over time. This is because the temporary data store will go from storing 0B of data to reaching its cap of 1.25G of data (in the default deployment). Once this cap is hit, old data is expired and the memory utilization shouldn’t increase anymore.
Pixie has a minimum 1GiB memory requirement per node. The default deployment is 2GiB of memory. To learn how to configure Pixie's memory usage, see the Tuning Memory Usage page.
Why is Pixie being OOMKilled?
This happens when Pixie is using more memory than the limit. Try increasing the limit, or reducing the amount of data stored in the table store. The amount of memory needed for Pixie depends on the application, but a minimum of 1Gi is required. However, for most clusters we recommend 2Gi. For more information, see the Tuning Memory Usage page.
Troubleshooting Pixie tracepoint scripts
I’m not seeing any data for my distributed bpftrace script.
Rather than query data already collected by the Pixie Platform, Distributed bpftrace Deployment scripts extend the Pixie platform to collect new data sources by deploying tracepoints when the script is run. The first time this type of script is run, it will deploy the probe and query the data (but there won't be much data at this point). Re-running the script after the probe has had more time to gather data will produce more results.
I'm getting error that tracepoints failed to deploy.
Run the px/tracepoint_status script. It should show a longer error message in the "Tracepoint Status" table.
How do I remove a tracepoint table?
It is not currently possible to remove a table. Instead, we recommend renaming the table name (e.g. table_name_0) while debugging the script.
Troubleshooting a Pixie Plugin
Why isn't my data exporting when using the Pixie Plugin?
Here are some things to check if you are not seeing exported data when using the Pixie Plugin:
Is Pixie working properly? If you just installed Pixie, did it finish deploying? Are you able to see data in the Live UI?
Do you see errors in the vizier-query-broker-* pod logs?
How do I check the status or history of an export script?
Navigate to the Live UI's data export configuration page by clicking the database icon in the left side menu:
Click the database icon to navigate to the data export configuration page.
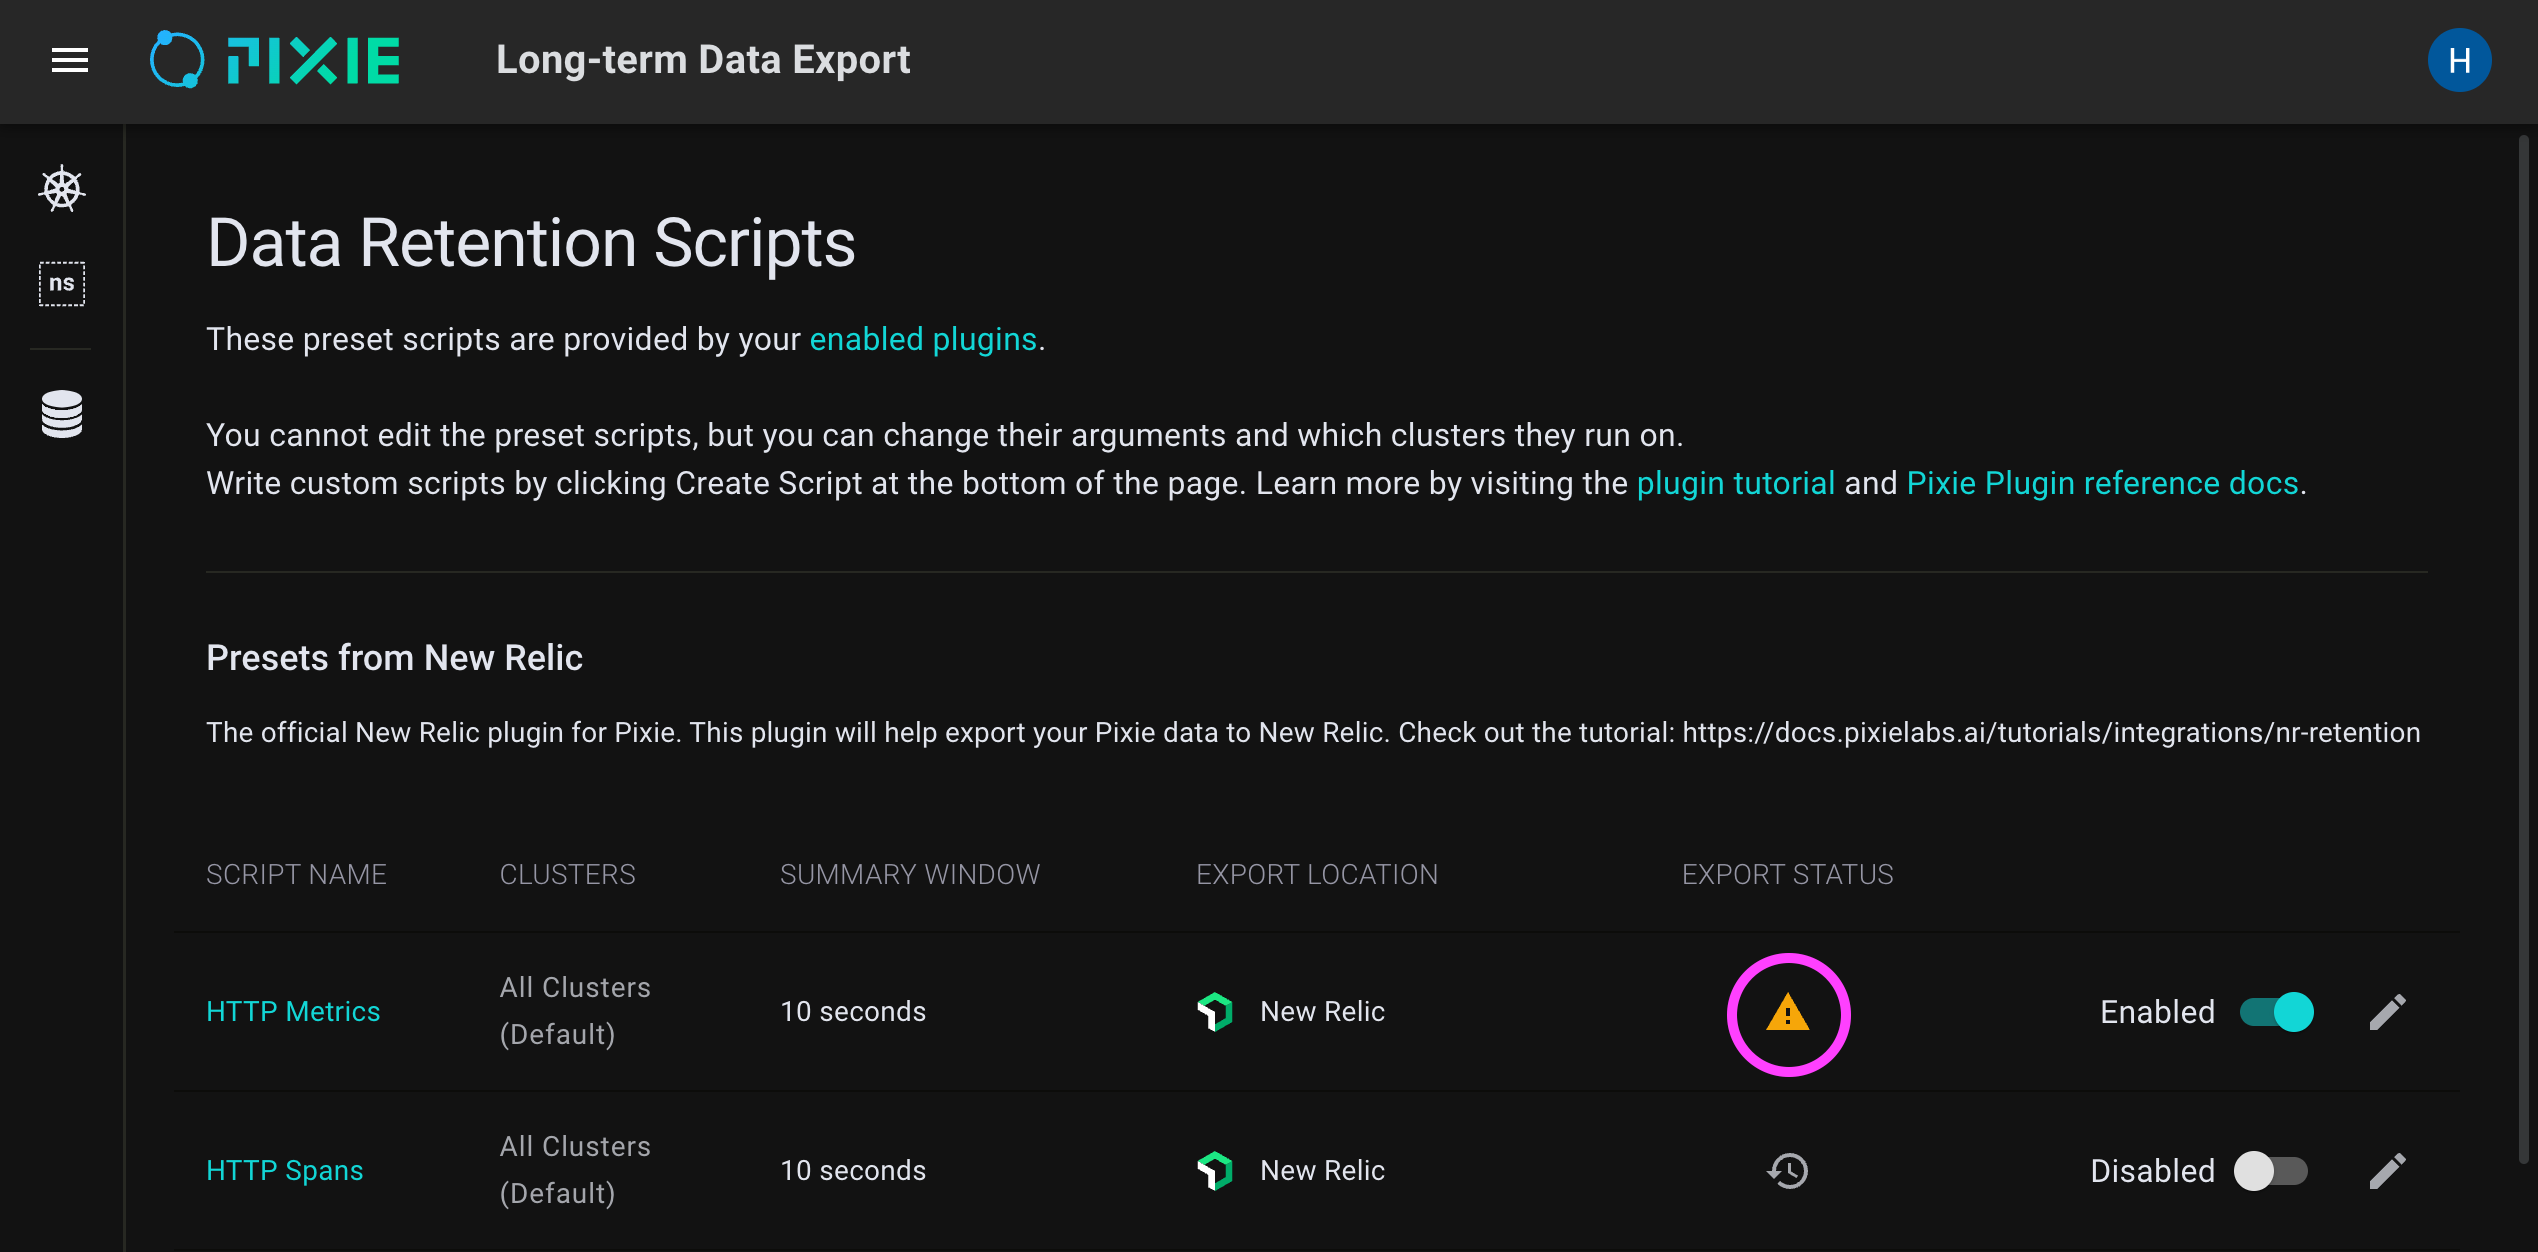
Pick an export script and click the icon in the EXPORT STATUS column.
Click the Export Status icon to navigate to the export history page.
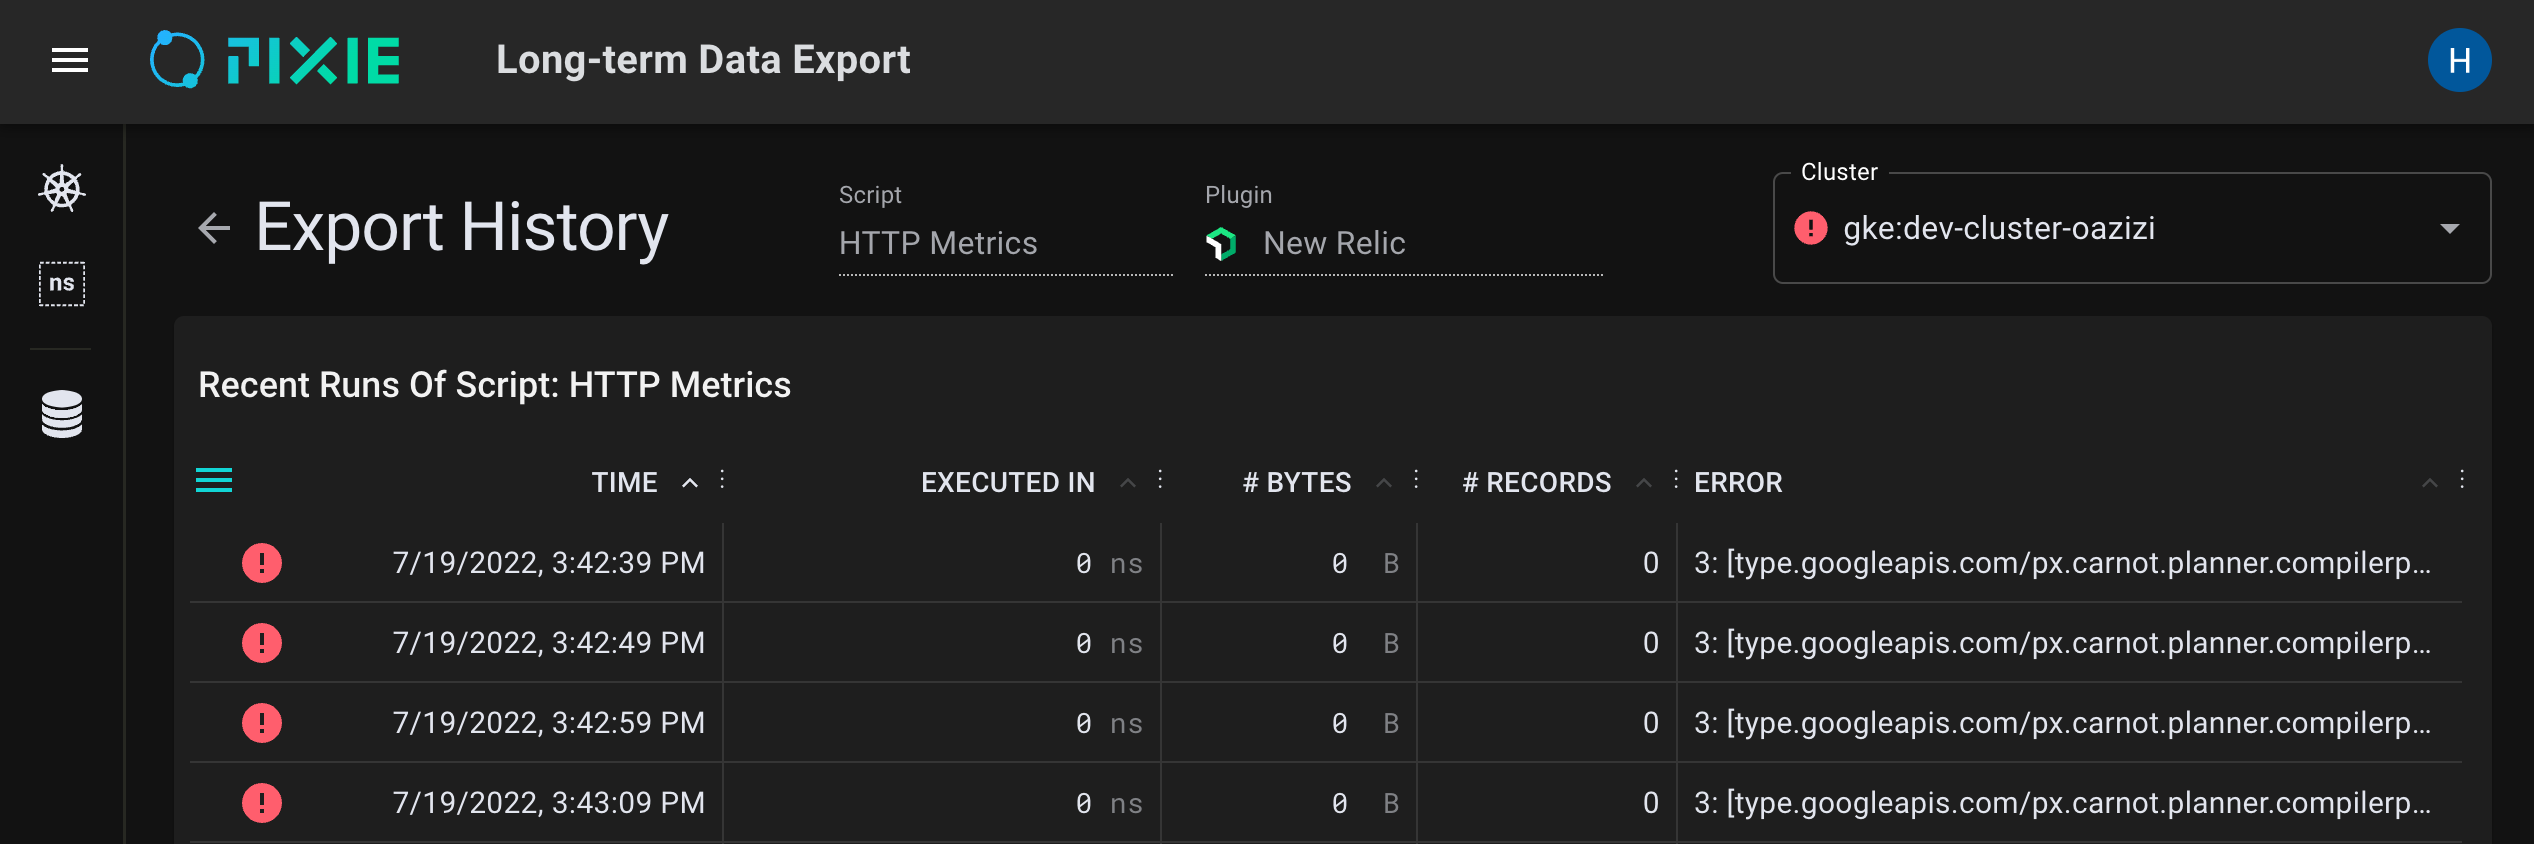
Select a cluster from the top right drop-down menu.
Click the Export Status icon to navigate to the plugin export logs.
To see the contents of a truncated ERROR table cell, click the cell.
How do I check the Pixie logs for plugin errors?
To debug Pixie Plugin issues, first check for errors in the kelvin-* pod logs.
If you provided an incorrect custom export URL (when enabling the plugin), you may see an error like one of the following:
Query c6139bff-880d-473a-98aa-2a6ca9543dd3 failed, reason: Internal : OTel export(carnot node_id=157) failed with error 'UNAVAILABLE'. Details: failed to connect to all addresses
# or
Query c6139bff-880d-473a-98aa-2a6ca9543dd3 failed, reason: Internal: OTel export(carnot node_id=55) failed with error 'UNAVAILABLE'. Details: DNS resolution failed for service: otel-collector.default.svc.cluster.local:4317
If you provided an API key of an incorrect type (when enabling a third party Pixie Plugin), you may see an error like the following:
Next, check for errors in the vizier-query-broker-* pod logs.
Why isn't my data exporting when I run an OpenTelemetry export script in the Live UI?
The Live UI's Scratch Pad is great tool for quickly developing PxL scripts to export Pixie data in the OpenTelemetry format.
When developing OpenTelemetry export scripts in the Live UI, make sure that your PxL script calls px.display(). The Live UI requires scripts to call this function in order to execute a query. Note that the PxL scripts used by Pixie Plugins do not have the px.display() requirement. For more information, see the Export OpenTelemetry Data tutorial.
"OTel export failed with error 'UNIMPLEMENTED'. Details: unknown service"
If you see this error, the collector endpoint that you configured for your plugin does not implement the OpenTelemetry Collector protocol. You should verify that the endpoint is correct.
Alternatively you can deploy a demo collector by following the directions here.