Before you can create a dashboard, you will need to add Pixie as a datasource:
With Grafana open, select the cog icon from the left-side menu to show the configuration options.
Click on Data Sources. The data sources page opens showing a list of previously configured data sources for the Grafana instance.
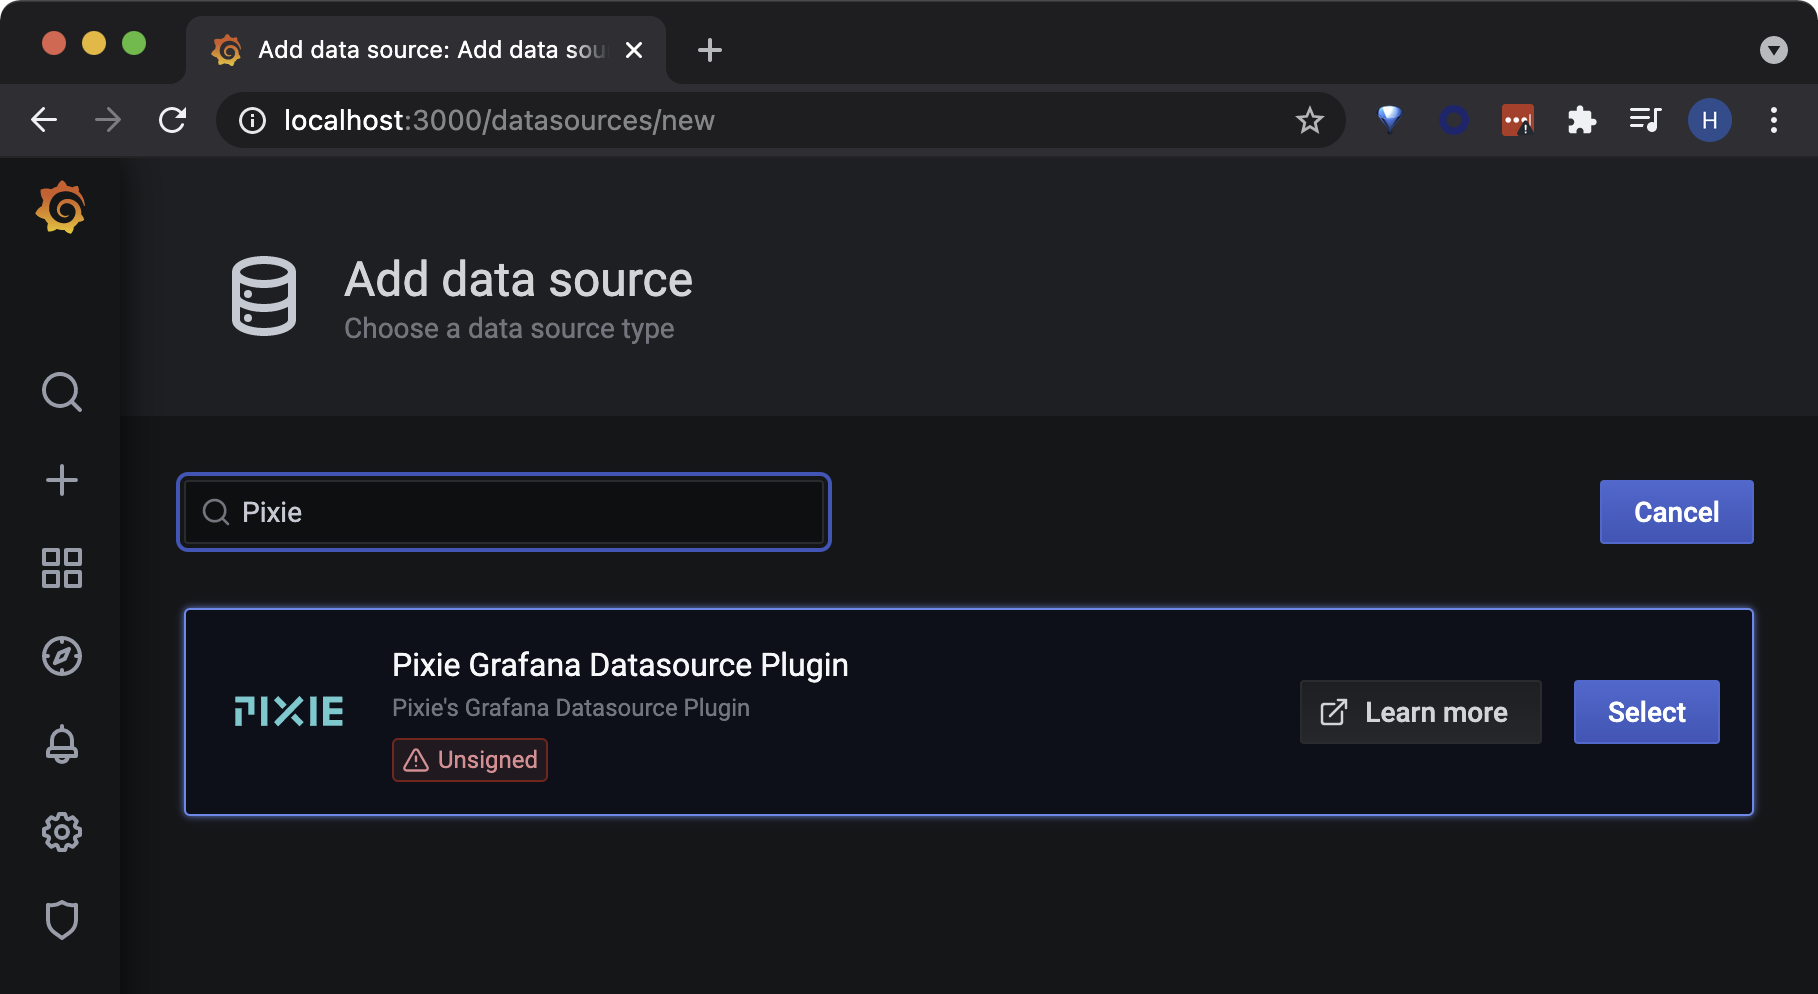
Click Add data source to see a list of all supported data sources.
Search for "Pixie Grafana Datasource Plugin" and press the Select button. The datasource configuration page will open.
The Pixie Plugin requires a Pixie API key and cluster ID to execute queries. To create an API Key, follow the directions here. To find your cluster's ID, follow the directions here.
The Cluster ID field is used to specify the default cluster to query. If you have Pixie installed on more than one cluster, you can create a cluster dashboard variable to view data for any cluster in your Pixie organization. If you don't use a cluster dashboard variable, the plugin will default to showing data for the cluster specified in the Cluster ID field.
Select the Save & Test button.
Add a Pixie dashboard
If you've used Pixie's Live UI or CLI, you should be familiar with the concept of open source PxL scripts. PxL scripts are used to query and visualize observability data collected by the Pixie platform. Developers use PxL scripts to monitor and debug a wide range of use-cases.
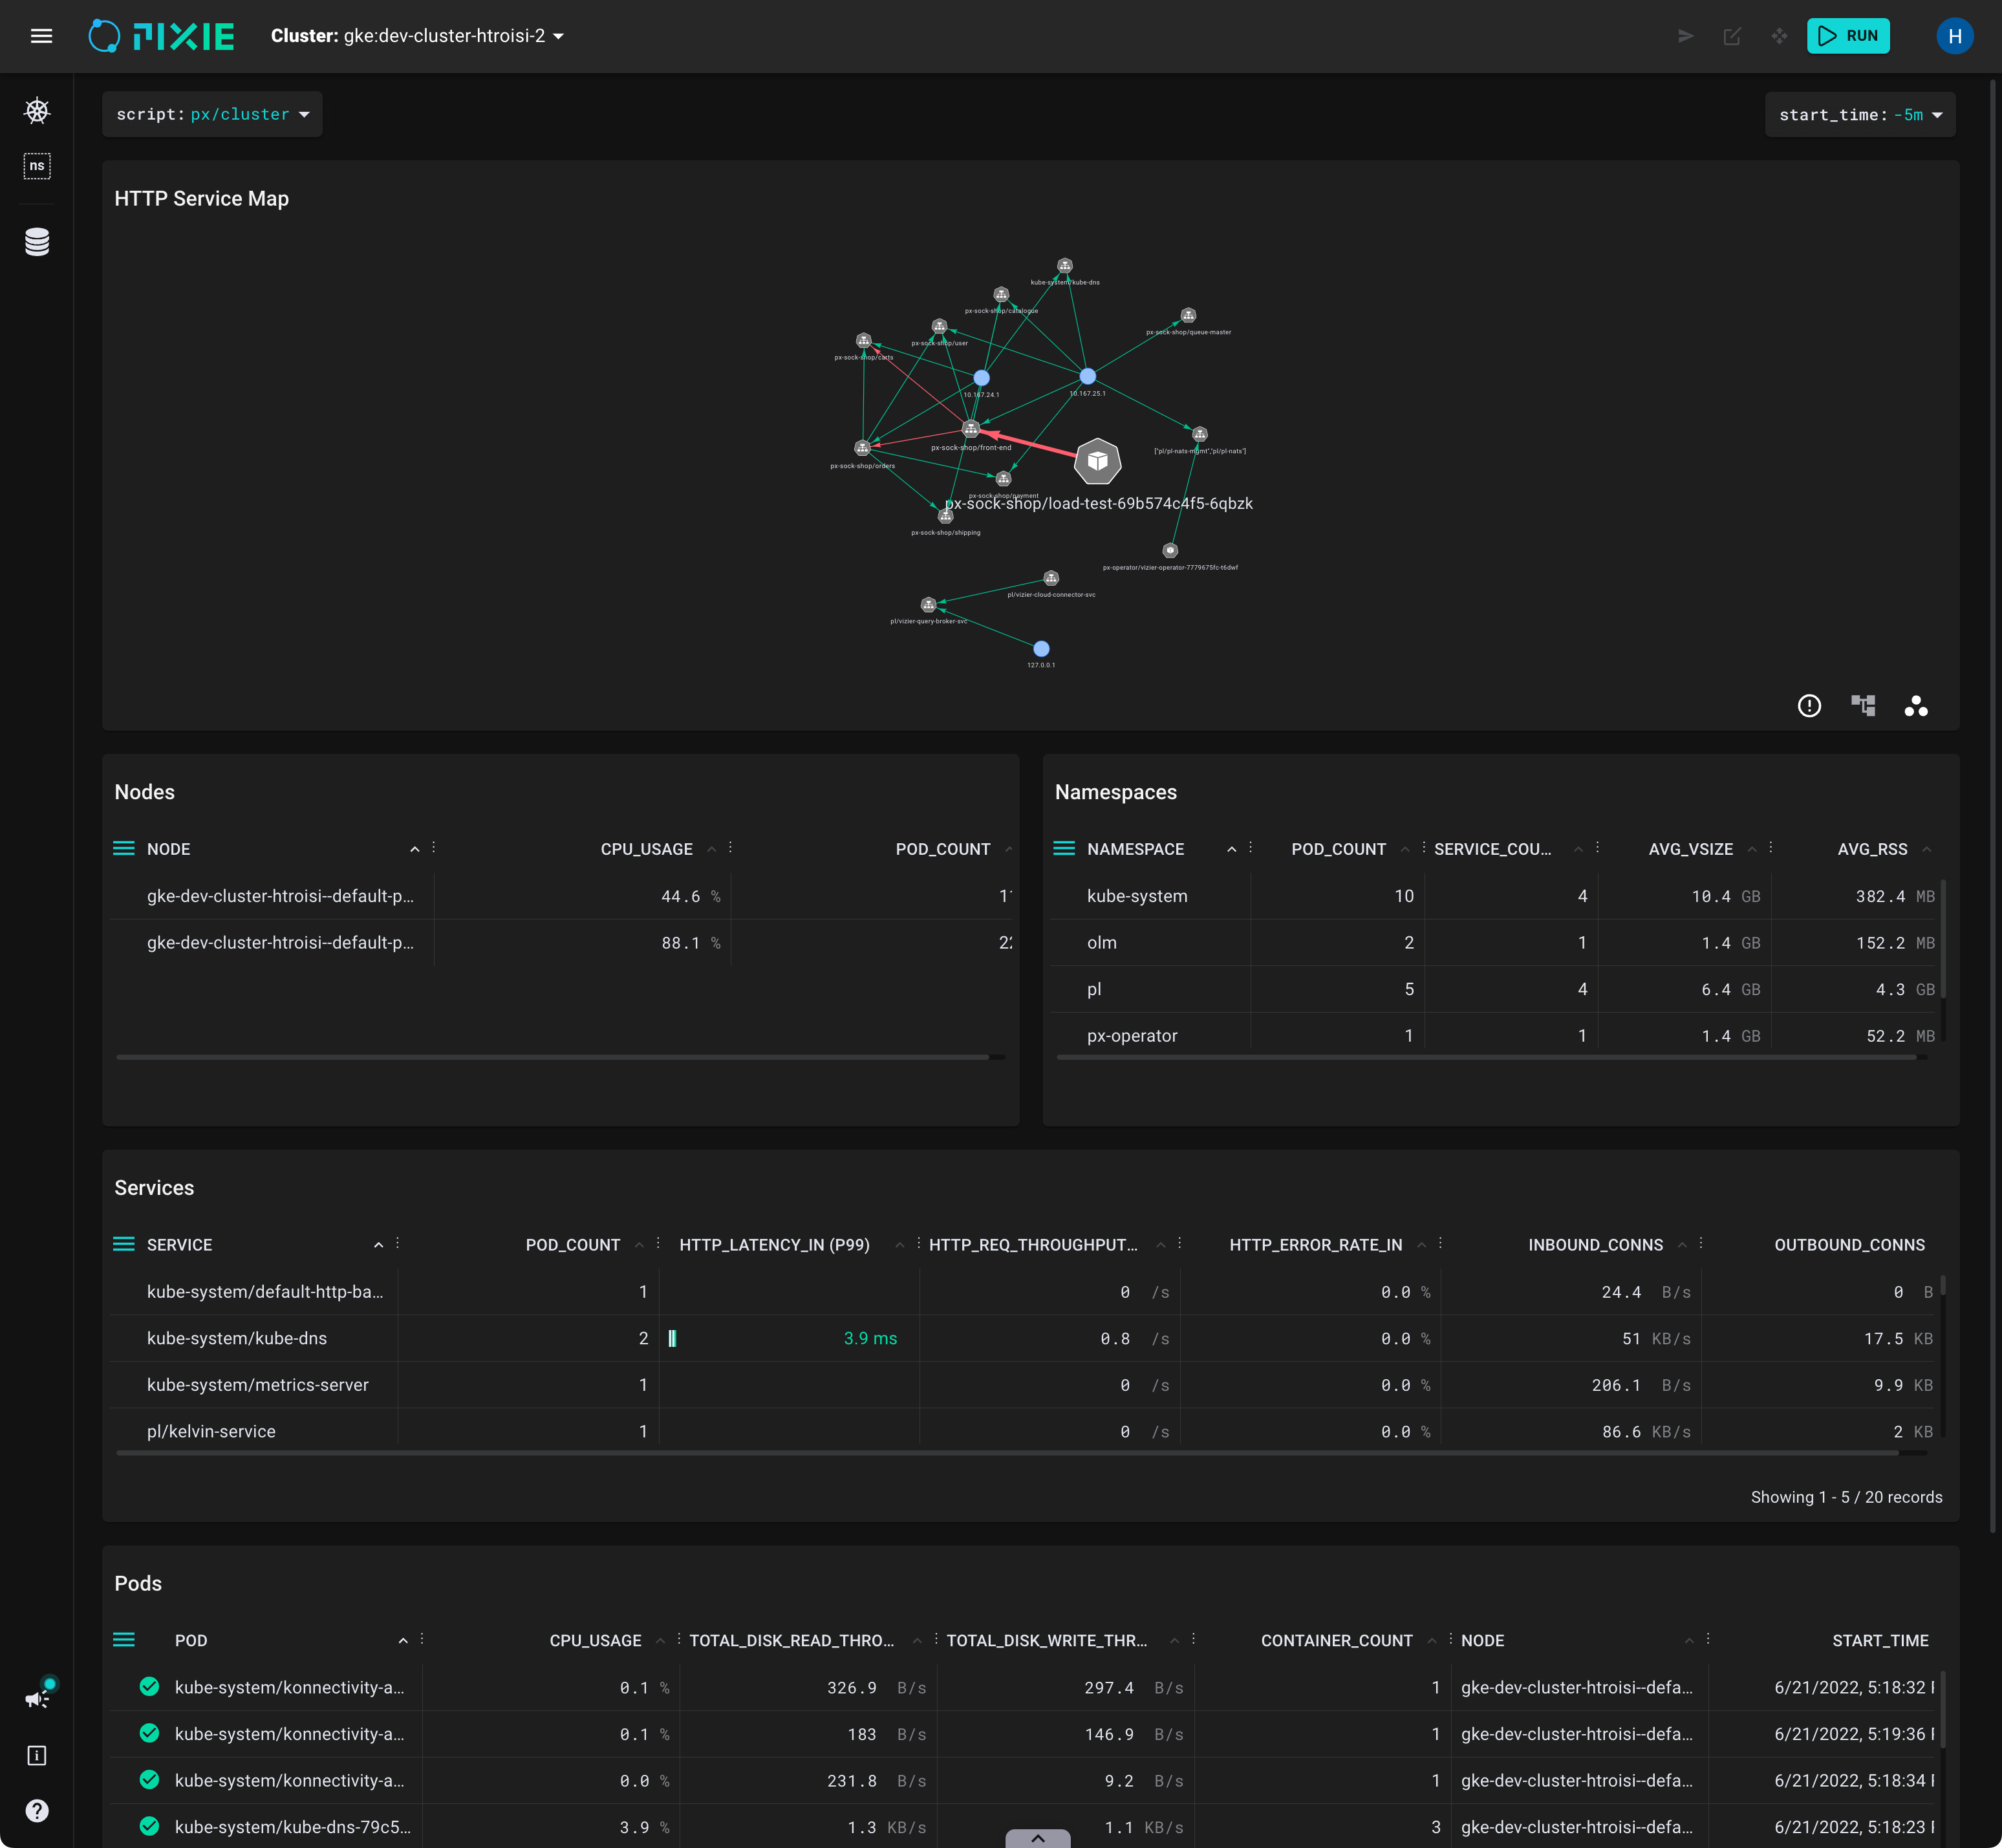
The px/cluster script seen in the Pixie Live UI. This view includes an HTTP service map and lists the nodes, namespaces, services and pods that are available on the current cluster.
Several of Pixie's most popular PxL scripts have been made available as Grafana dashboards. You can find the dashboard JSON files here.
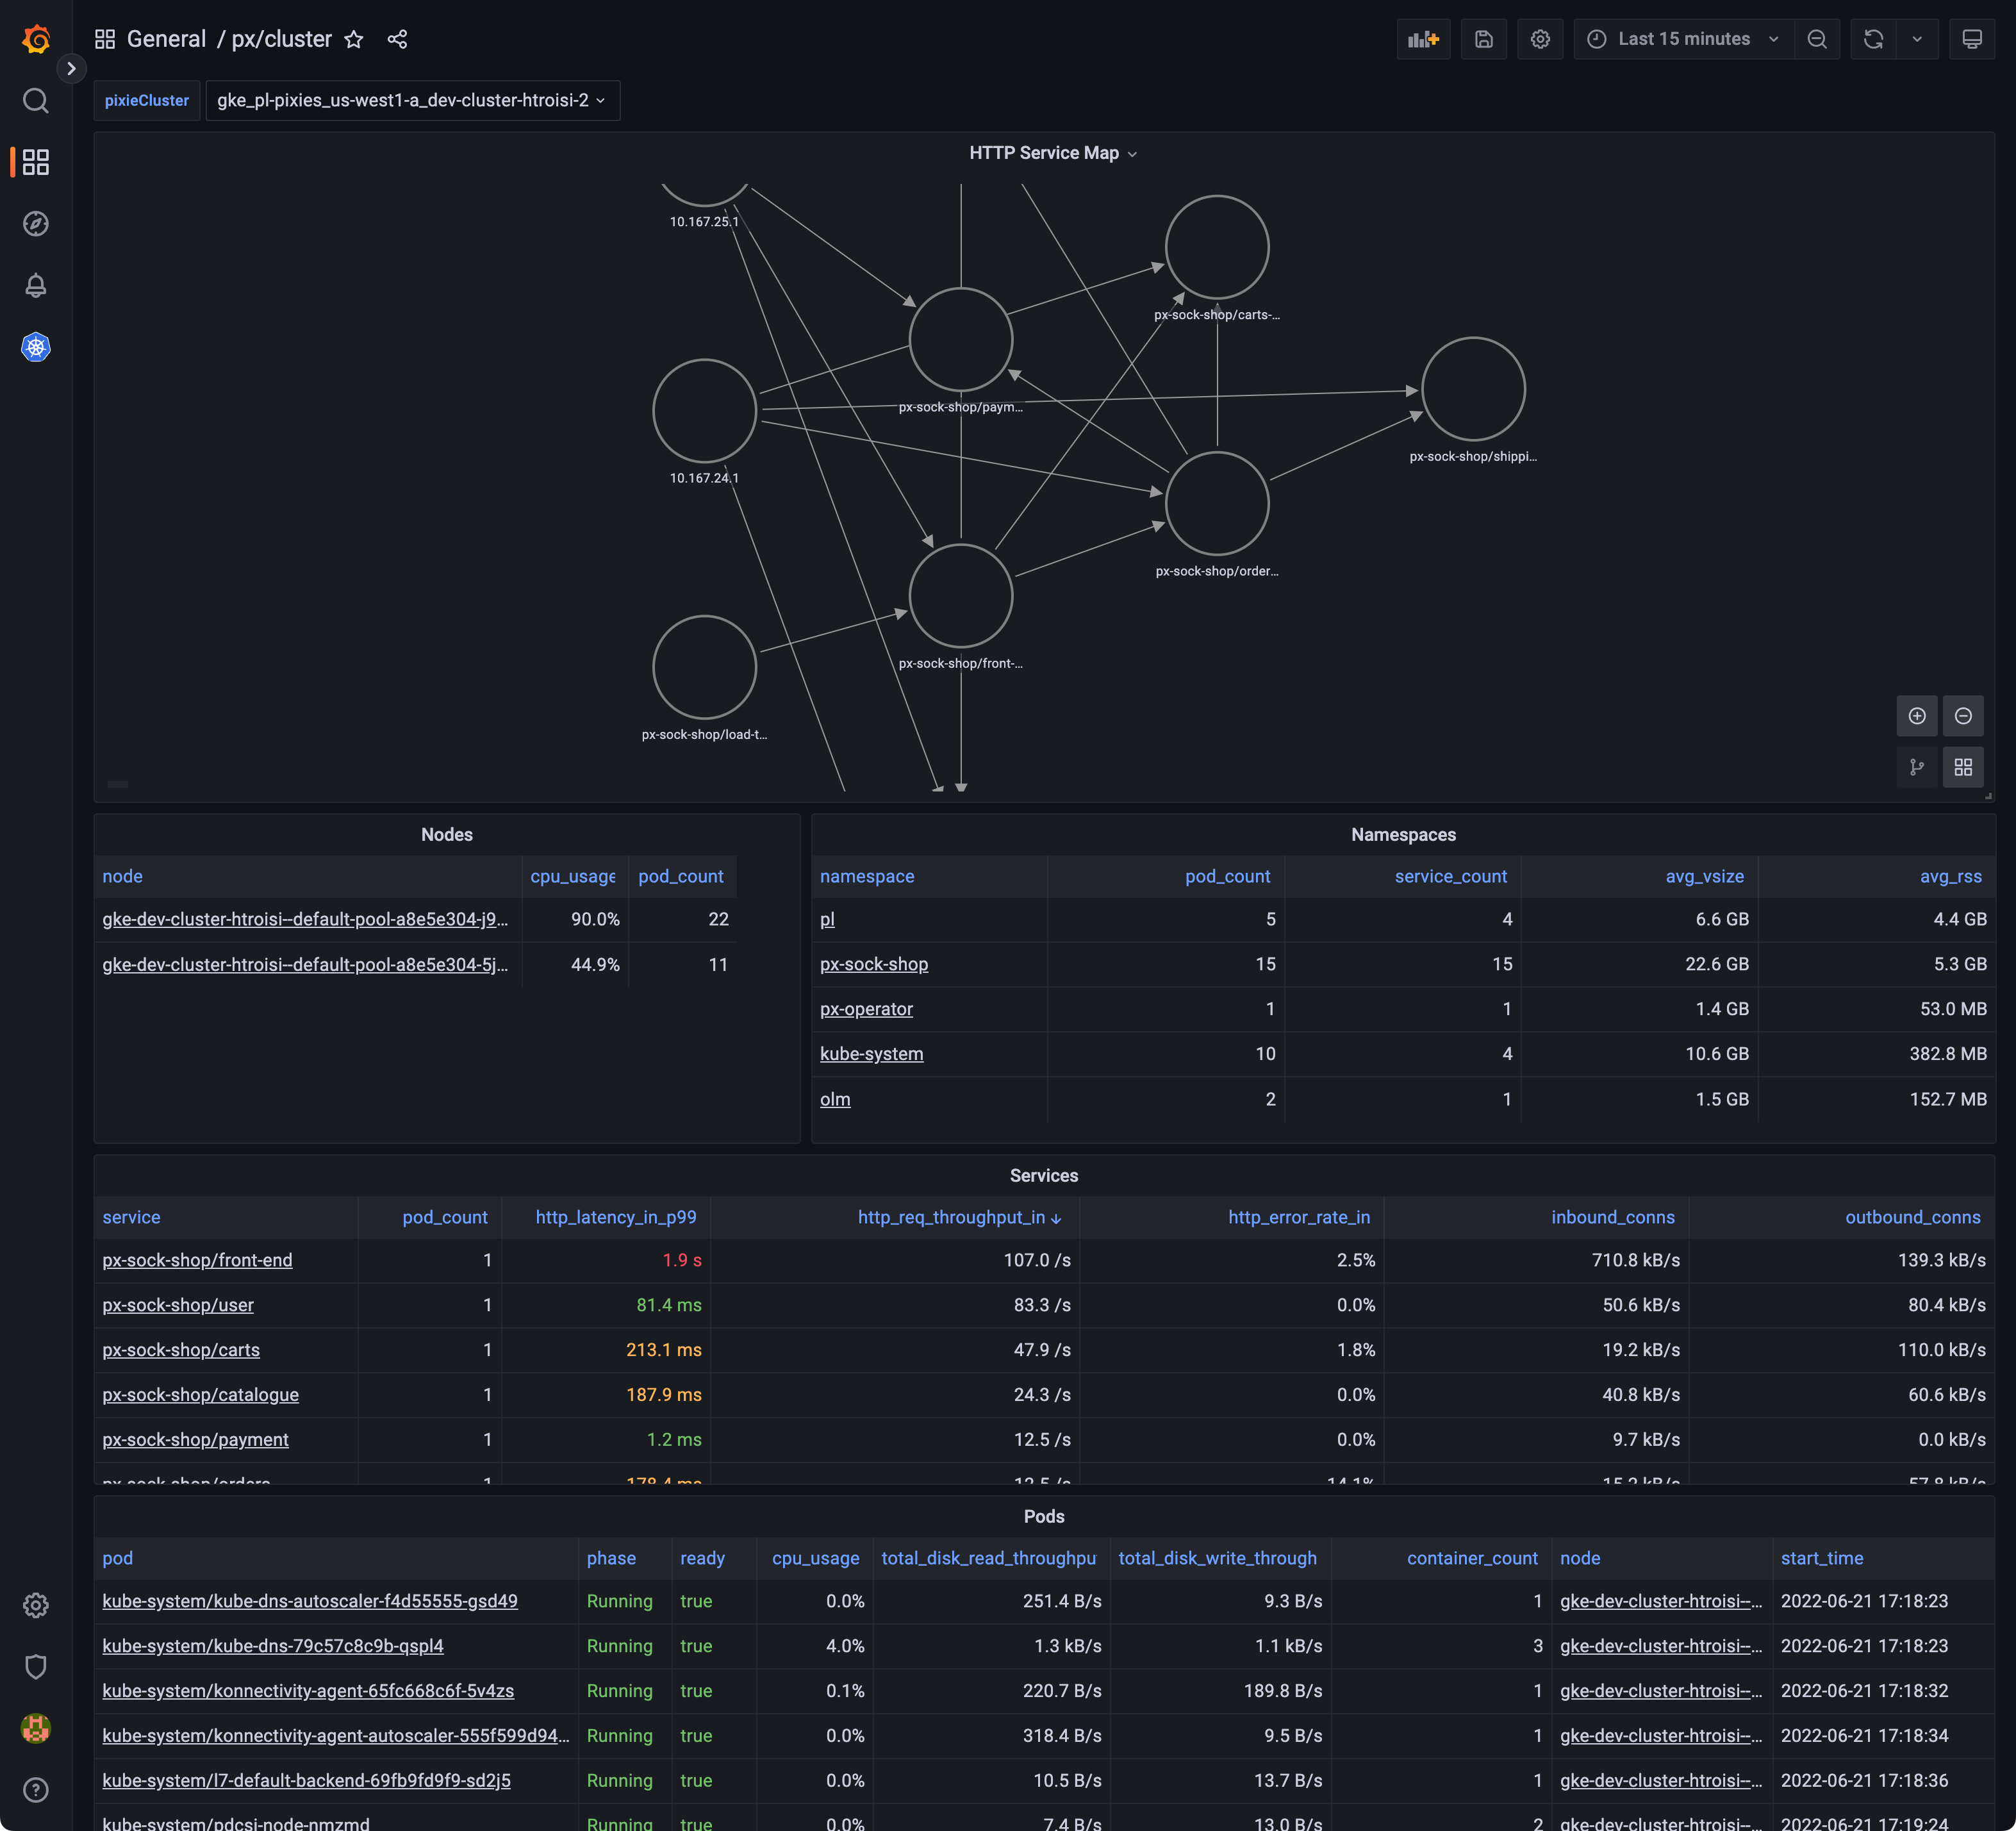
The px/cluster dashboard seen in Grafana.
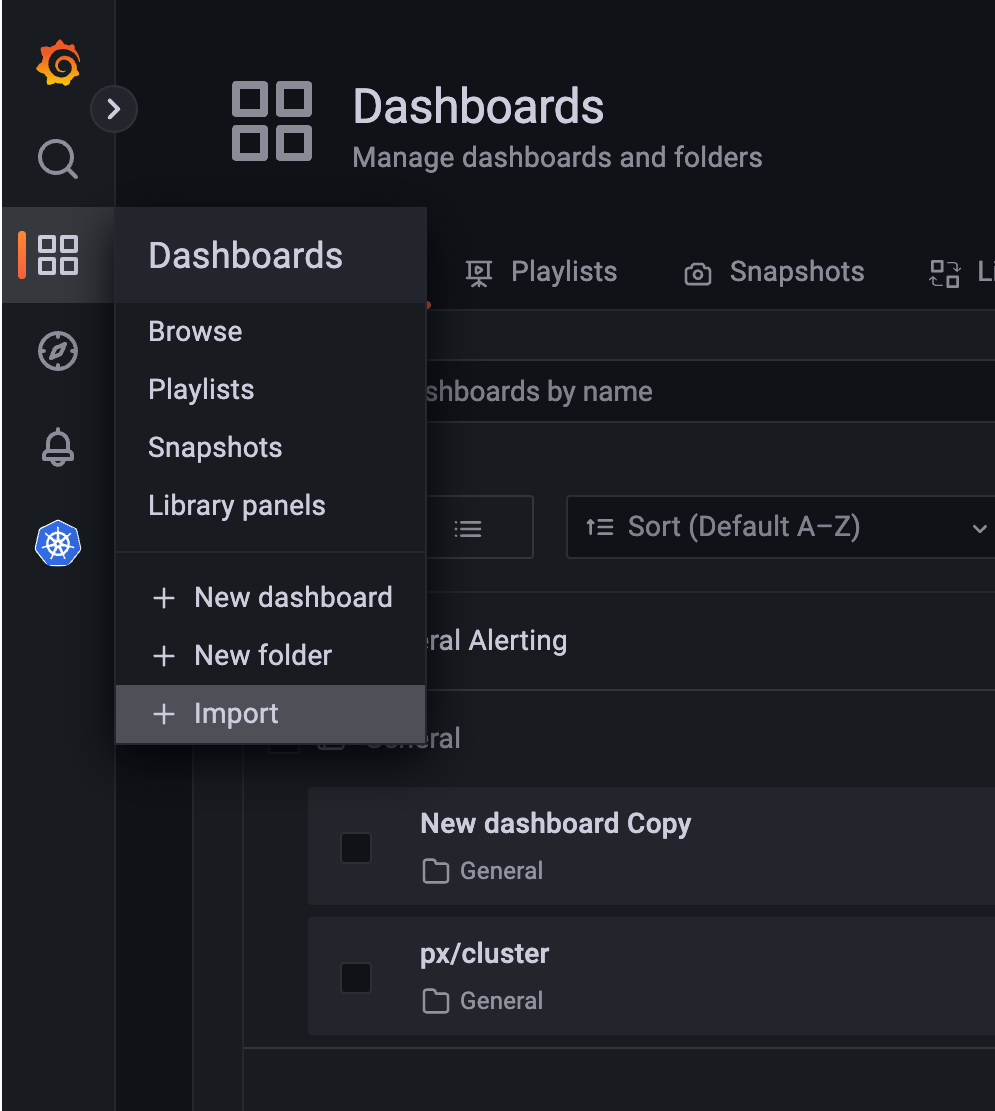
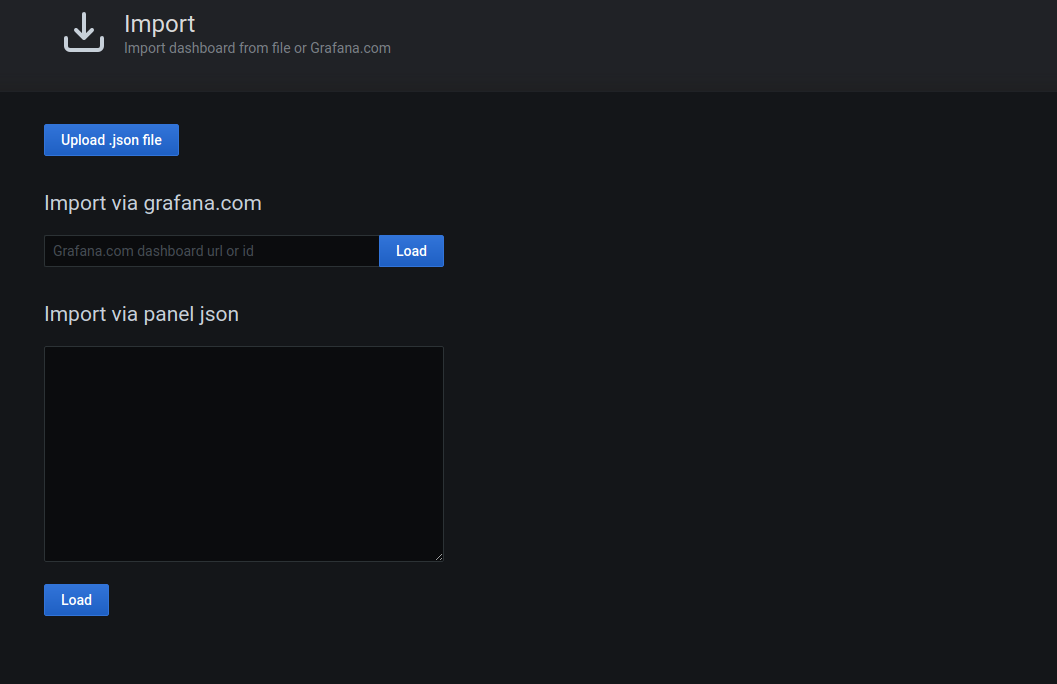
Import a Pixie dashboard
To import a Pixie dashboard:
Click Import under the Dashboards icon in the side menu.
Upload a dashboard JSON file or paste the dashboard JSON text directly into the text area. The JSON files for Pixie's dashboards are located here.
Click the New dashboard item under the Dashboards icon in the side menu.
In the new dashboard view, click Add an empty panel.
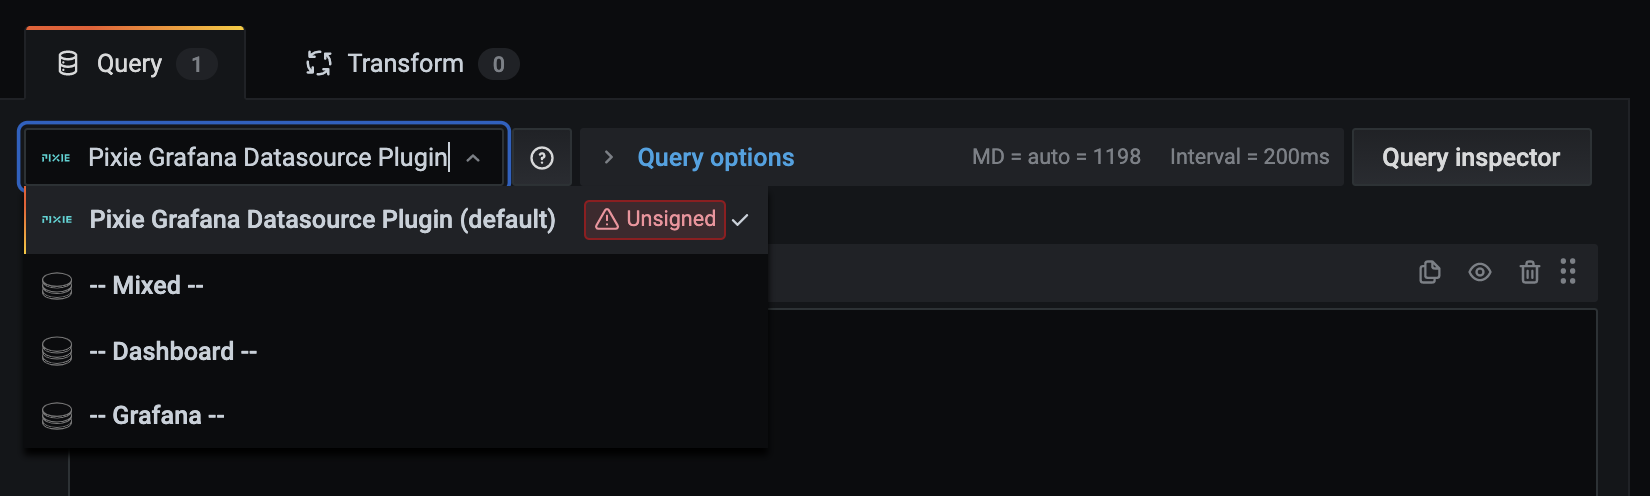
Select the Pixie datasource for your query
In the Edit Panel view, go to the Query tab.
Configure the query by selecting the Pixie Grafana Datasource Plugin from the data source selector.
Click the Save icon in the top right corner of your screen to save the dashboard.
Select a pre-made script
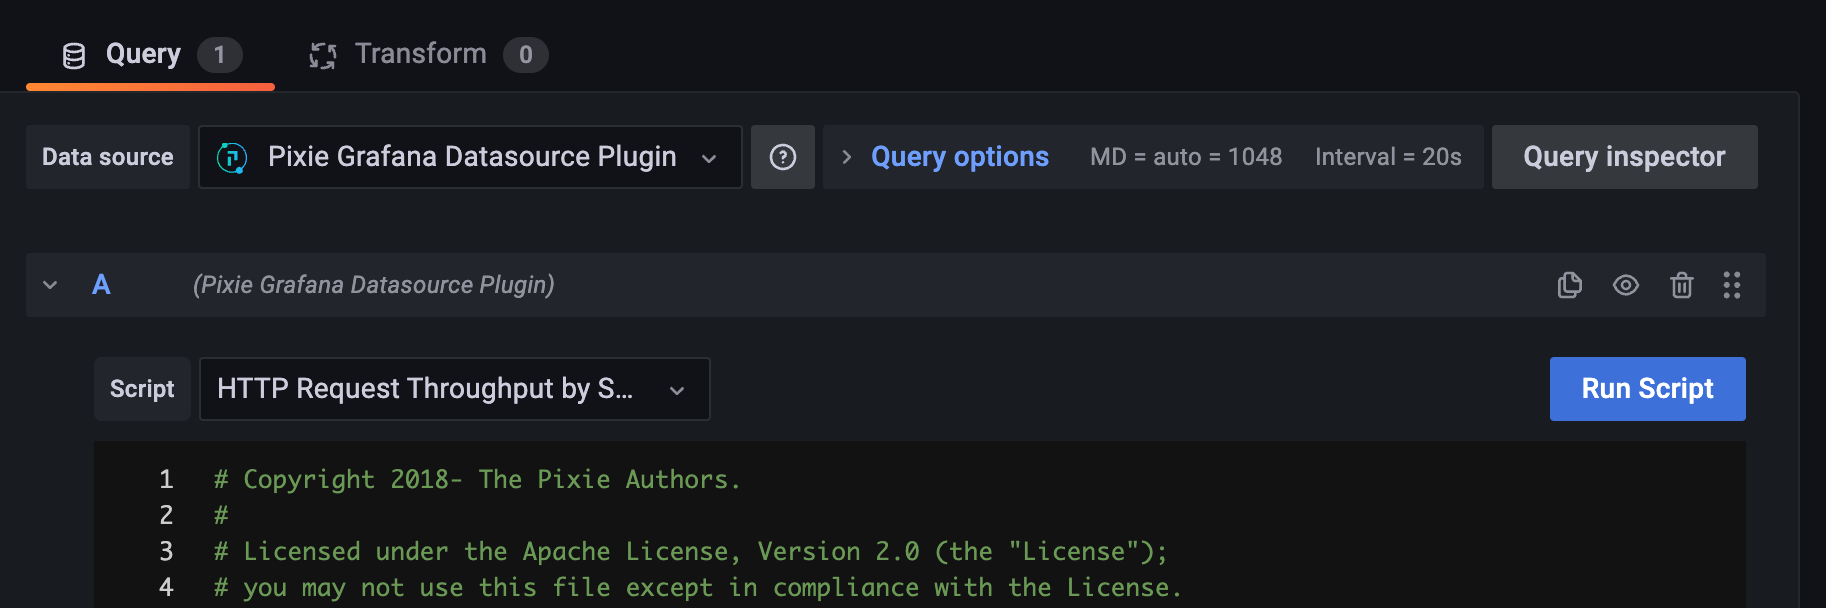
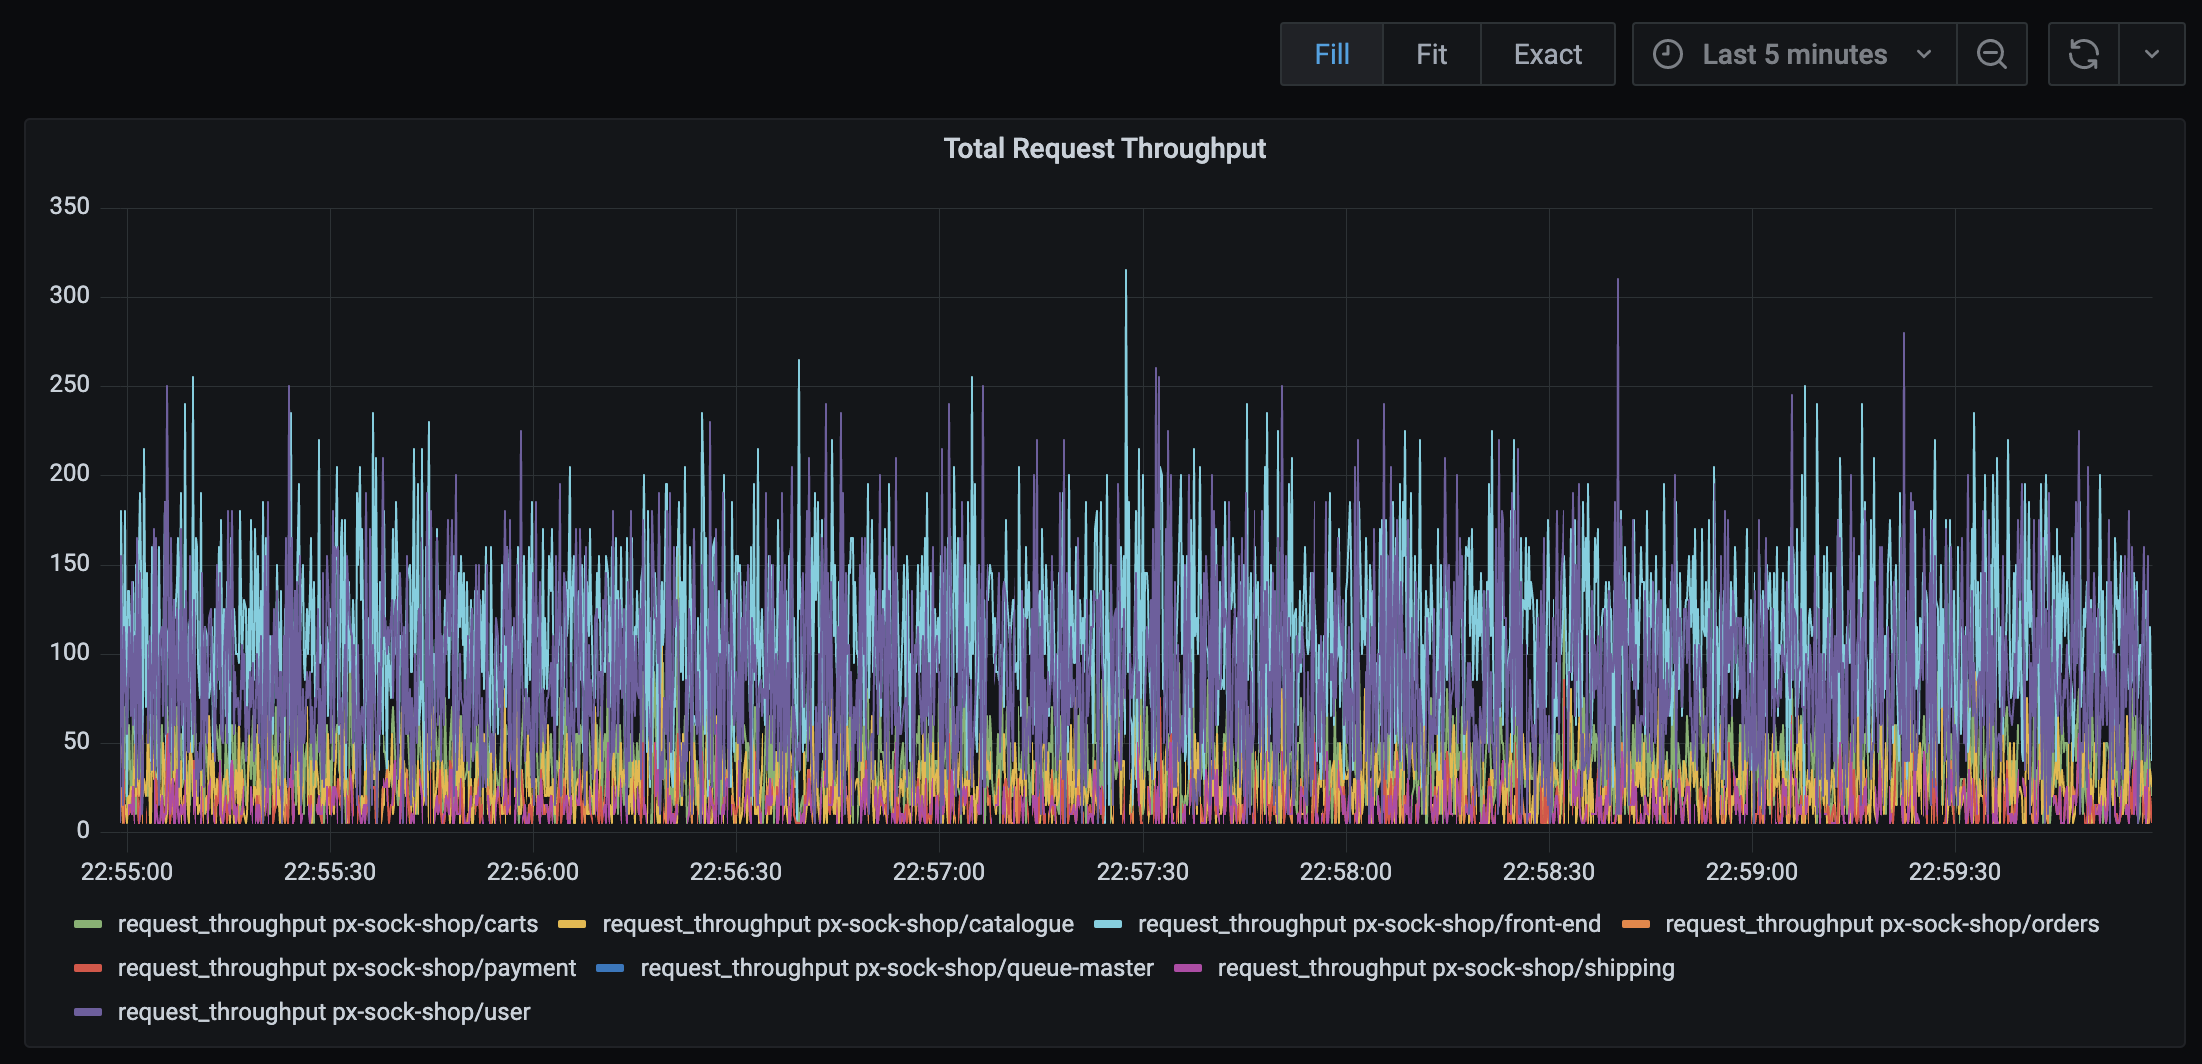
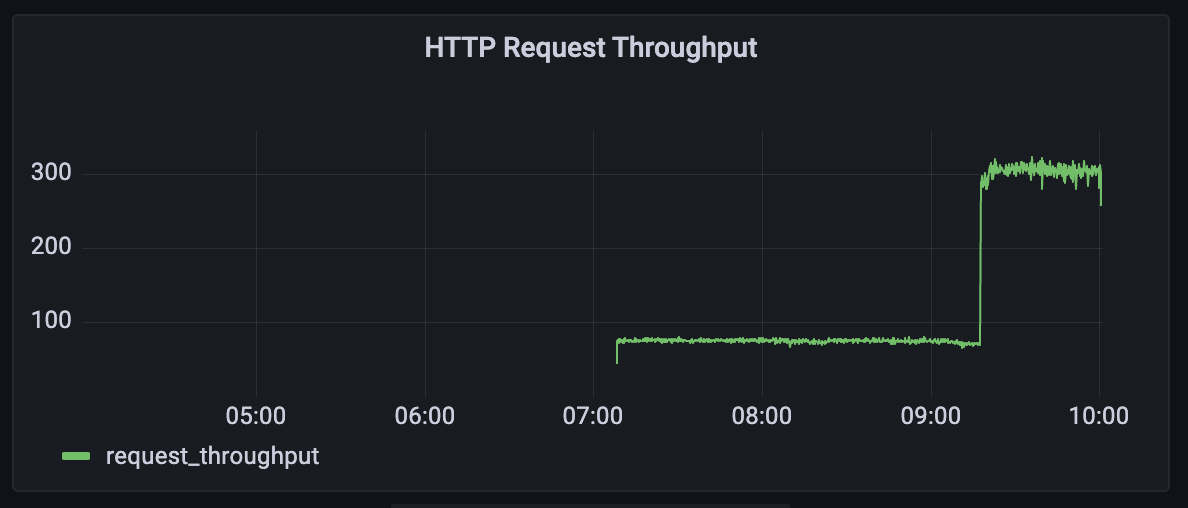
The Pixie Datasource Plugin offers several pre-written scripts that you can use to quickly create dashboard panels. Let's look at a script that creates a time series graph for HTTP throughput per service.
In the Query editor tab, select the HTTP Request Throughput by Service option from the Script drop-down selector.
The description of the script in the Script drop-down menu tells you which Grafana visualization panel type to use with the query. Select the Time series visualization type from the top right drop-down menu.
This script creates a time series graph of HTTP throughput per service. You should see data plotted over time, but the exact numbers will vary depending on the traffic in your cluster.
Output of the "HTTP Request Throughput by Service" Pixie Grafana plugin script.
(Optional) Add column filtering / grouping
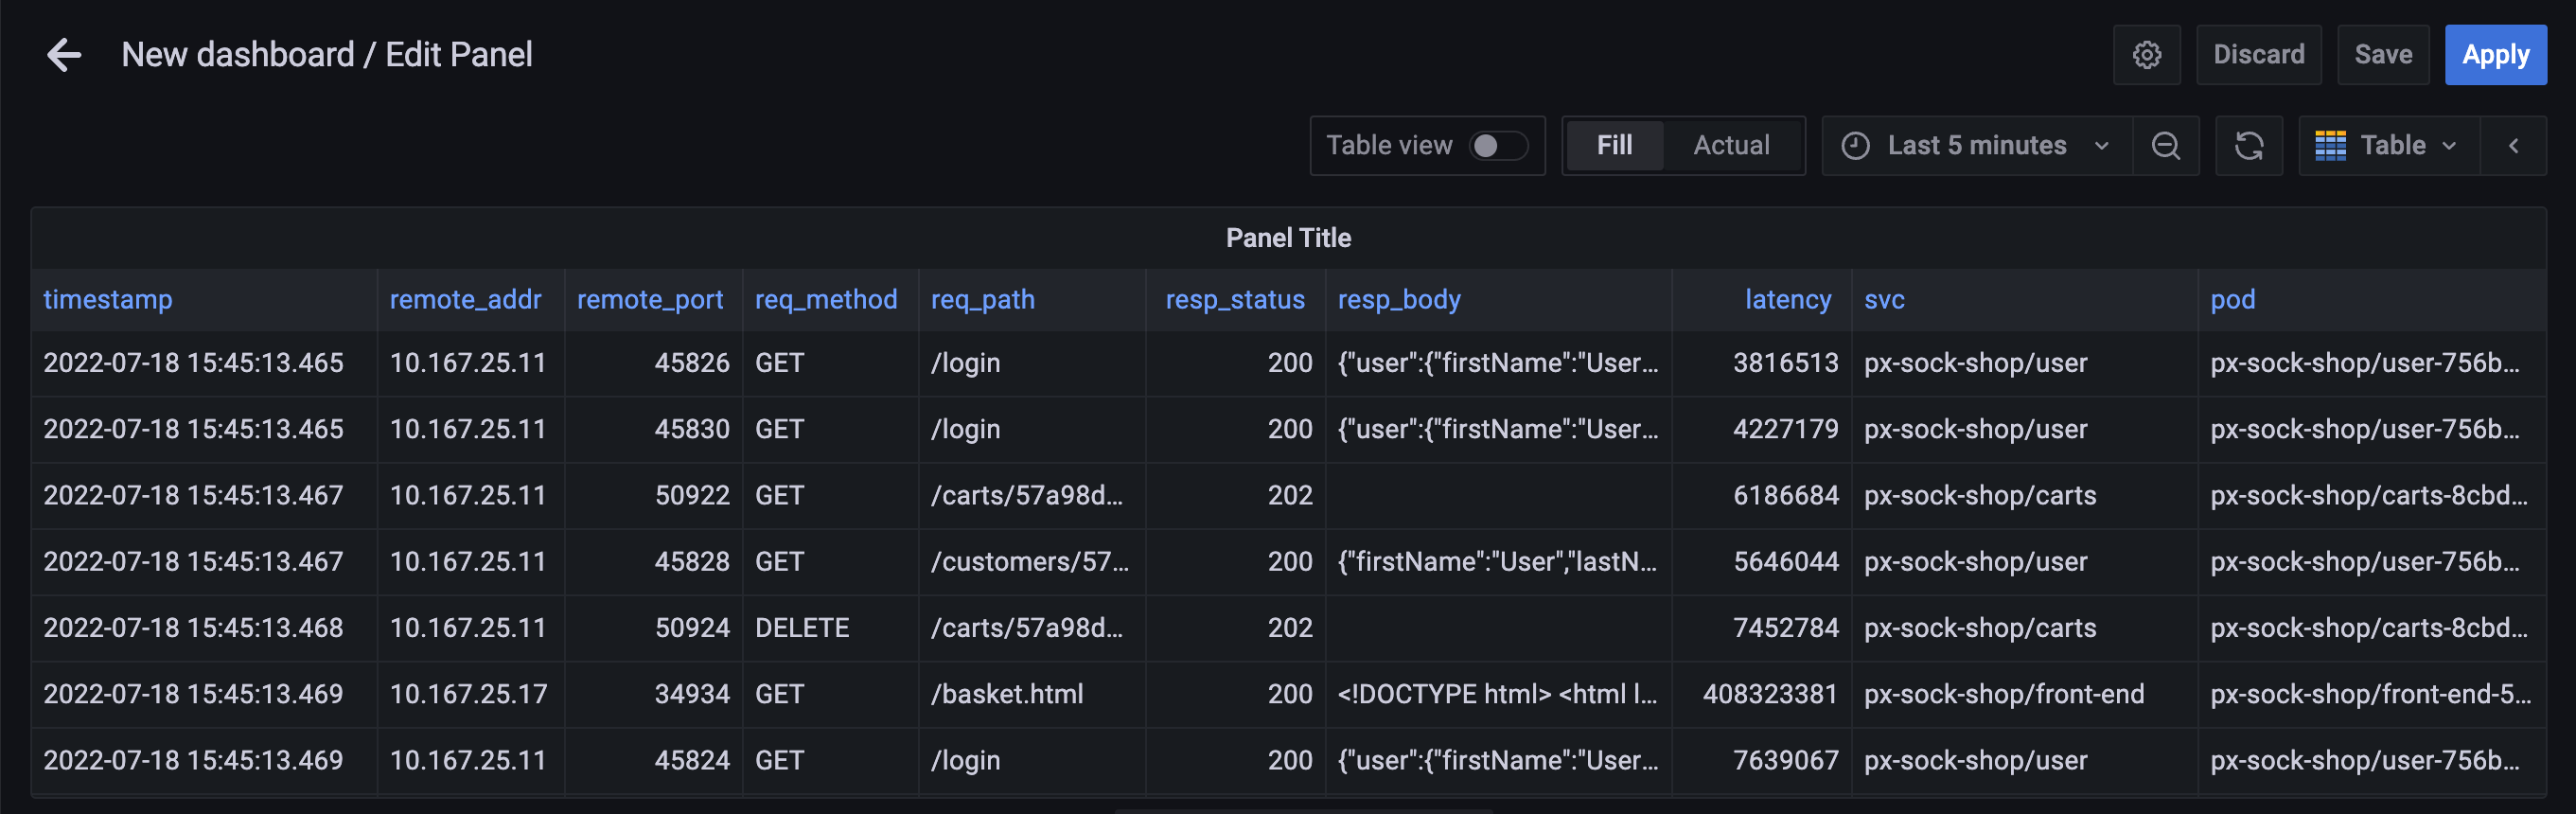
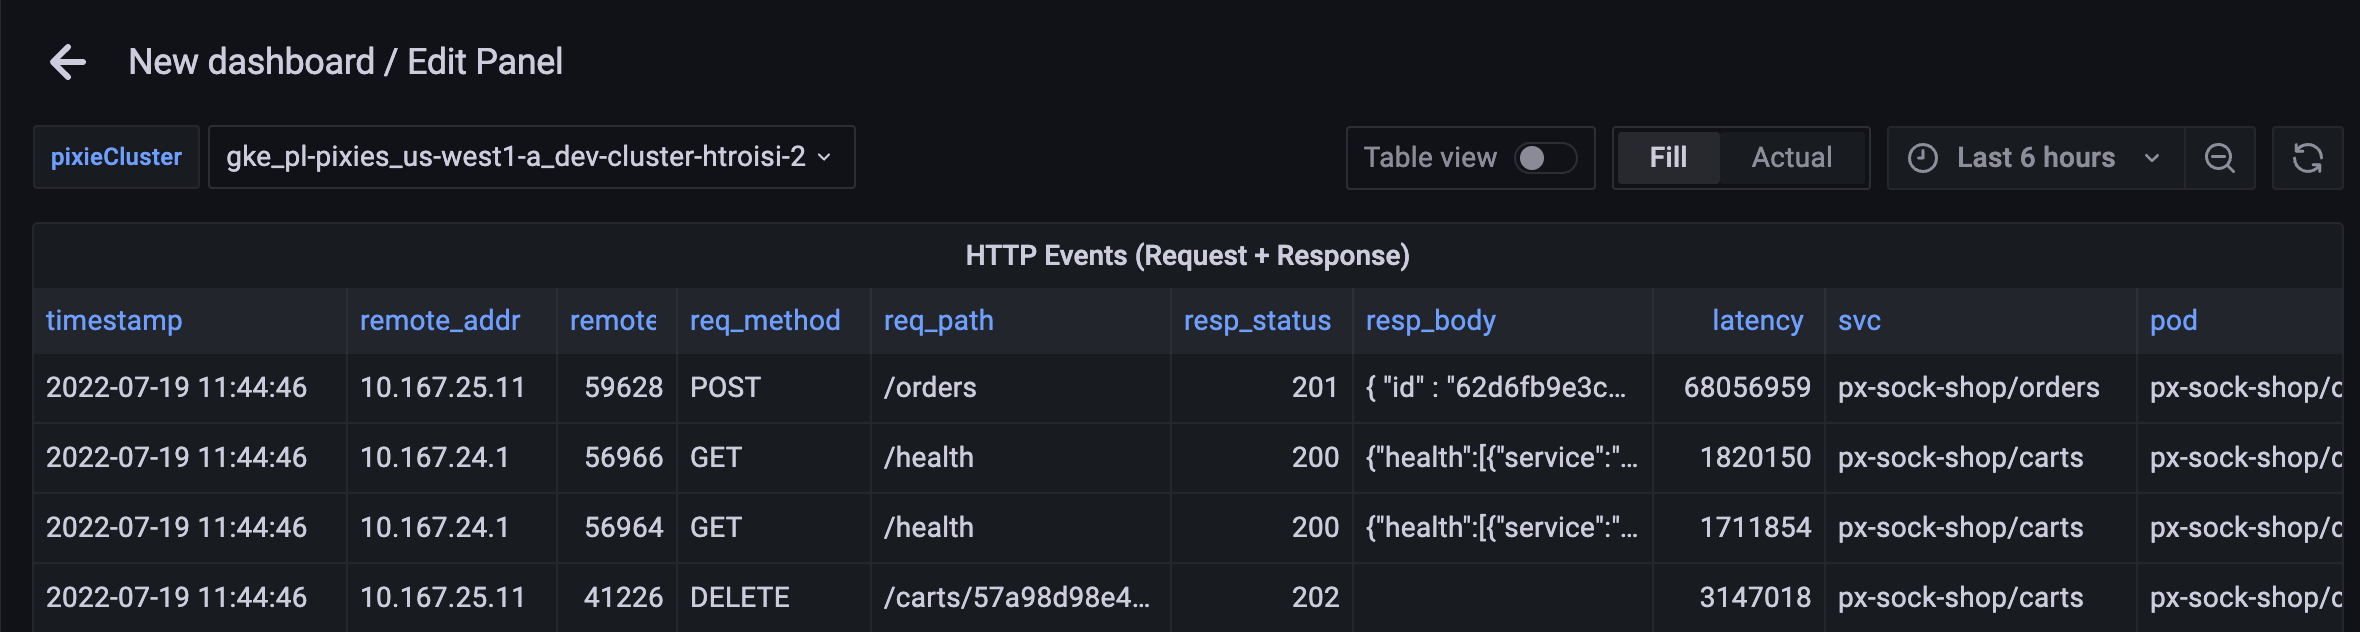
You can apply filtering / grouping to the output columns of the pre-made scripts. Let's look at a script that creates a table of the raw HTTP requests flowing through your cluster.
From the Query editor tab, select the Raw HTTP Events (Long Format) option from the Script drop-down selector.
The description of the script in the Script drop-down menu tells you that this script should be used with the Table visualization panel. Select the Table panel type from the top right drop-down menu.
This script shows all of the HTTP requests flowing through your cluster.
Output of the "Raw HTTP Events (Long Format)" Pixie Grafana plugin script.
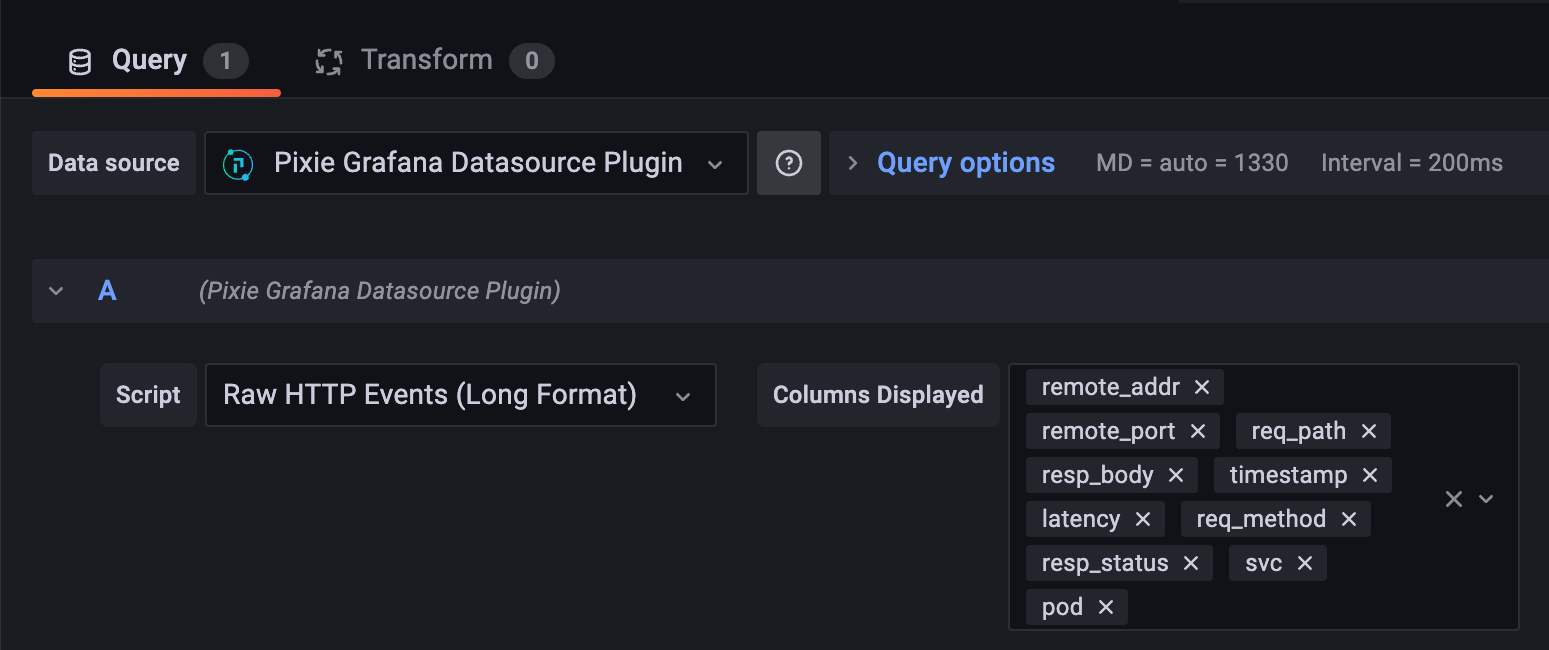
You can add or remove columns from the output table using the Columns Display selector.
You can group the columns and apply an aggregate function using the Groupby Columns selector.
In the image below, I've grouped the columns by unique HTTP request path (req_path) and selected the Add Aggregate Pair button to count the number of HTTP requests per unique request path.
Remove the Groupby column filtering before proceeding to the next section.
(Optional) Add dashboard variables
Grafana offers dashboard variables to help you create more interactive dashboards.
Cluster name
If you have Pixie installed on more than one cluster, you can create a pixieCluster dashboard variable to view data for any cluster in your Pixie organization. If you do not create a pixieCluster dashboard variable, the plugin will default to showing data for the Cluster ID specified when configuring the Pixie Datasource.
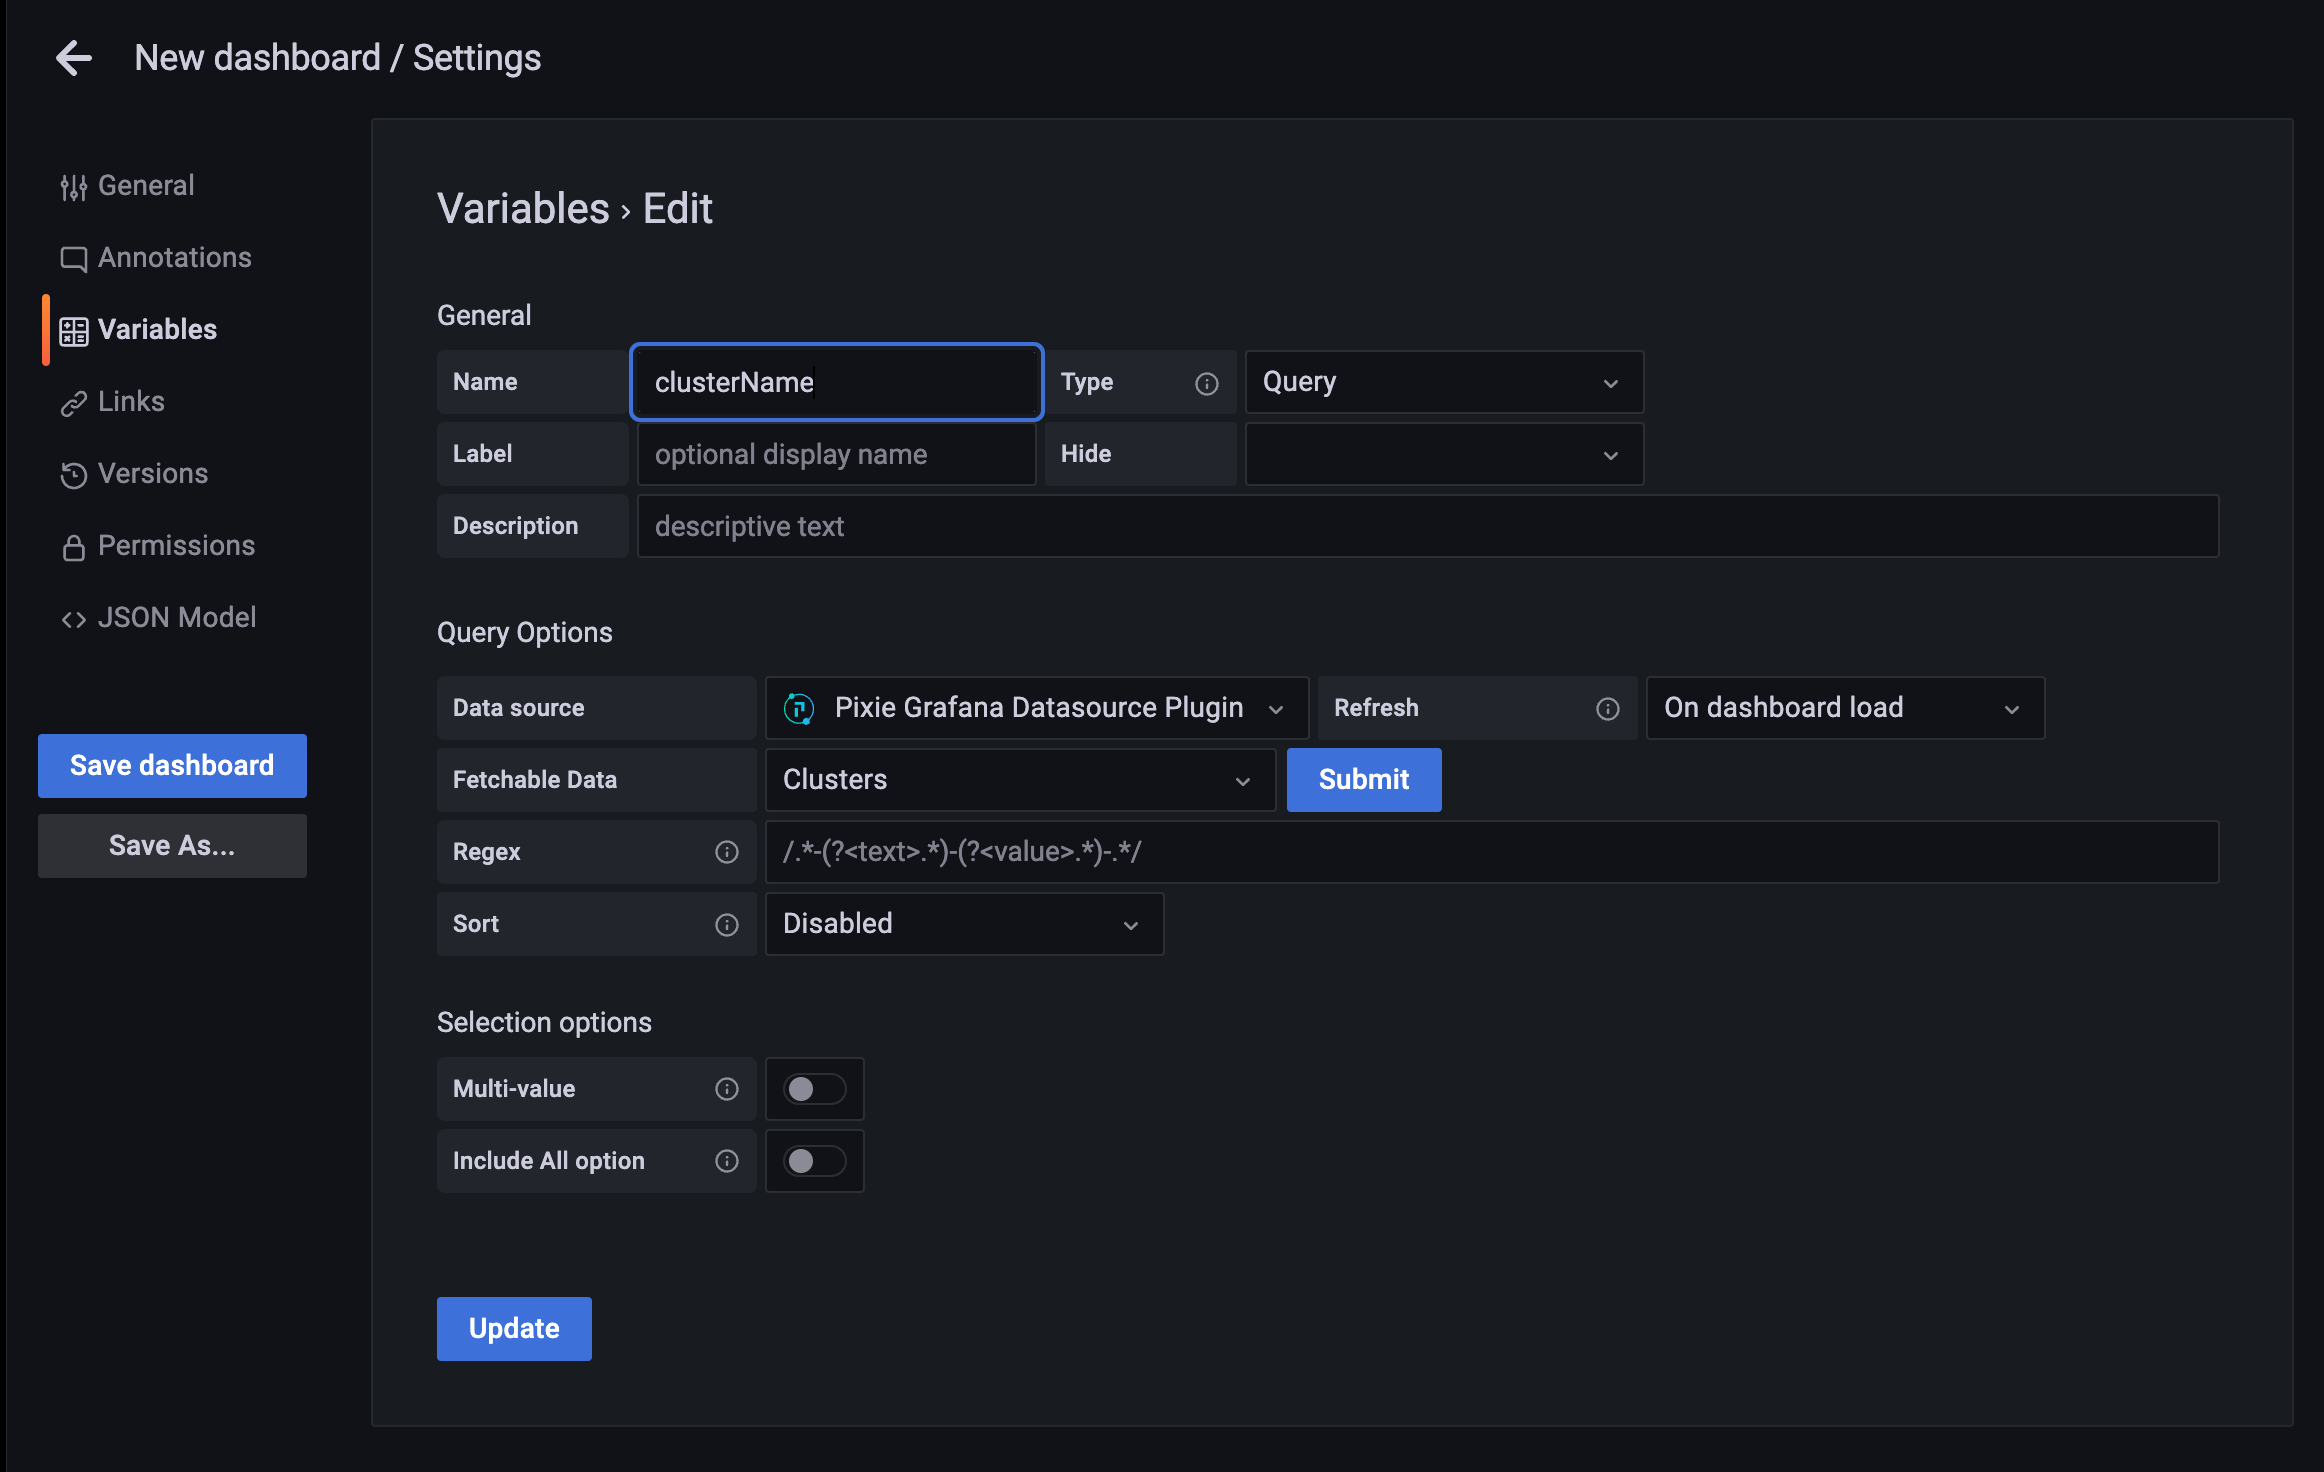
To create a new dashboard variable for cluster name:
Navigate to the Grafana dashboard settings.
Select the Variables option in the side menu, then click the Add variable button.
Under the General section, name the variable pixieCluster.
Under the Query Options section, select Clusters for Fetchable Data.
Click the Update button.
You can now select your cluster from the pixieCluster drop-down menu above the panel:
Pod name
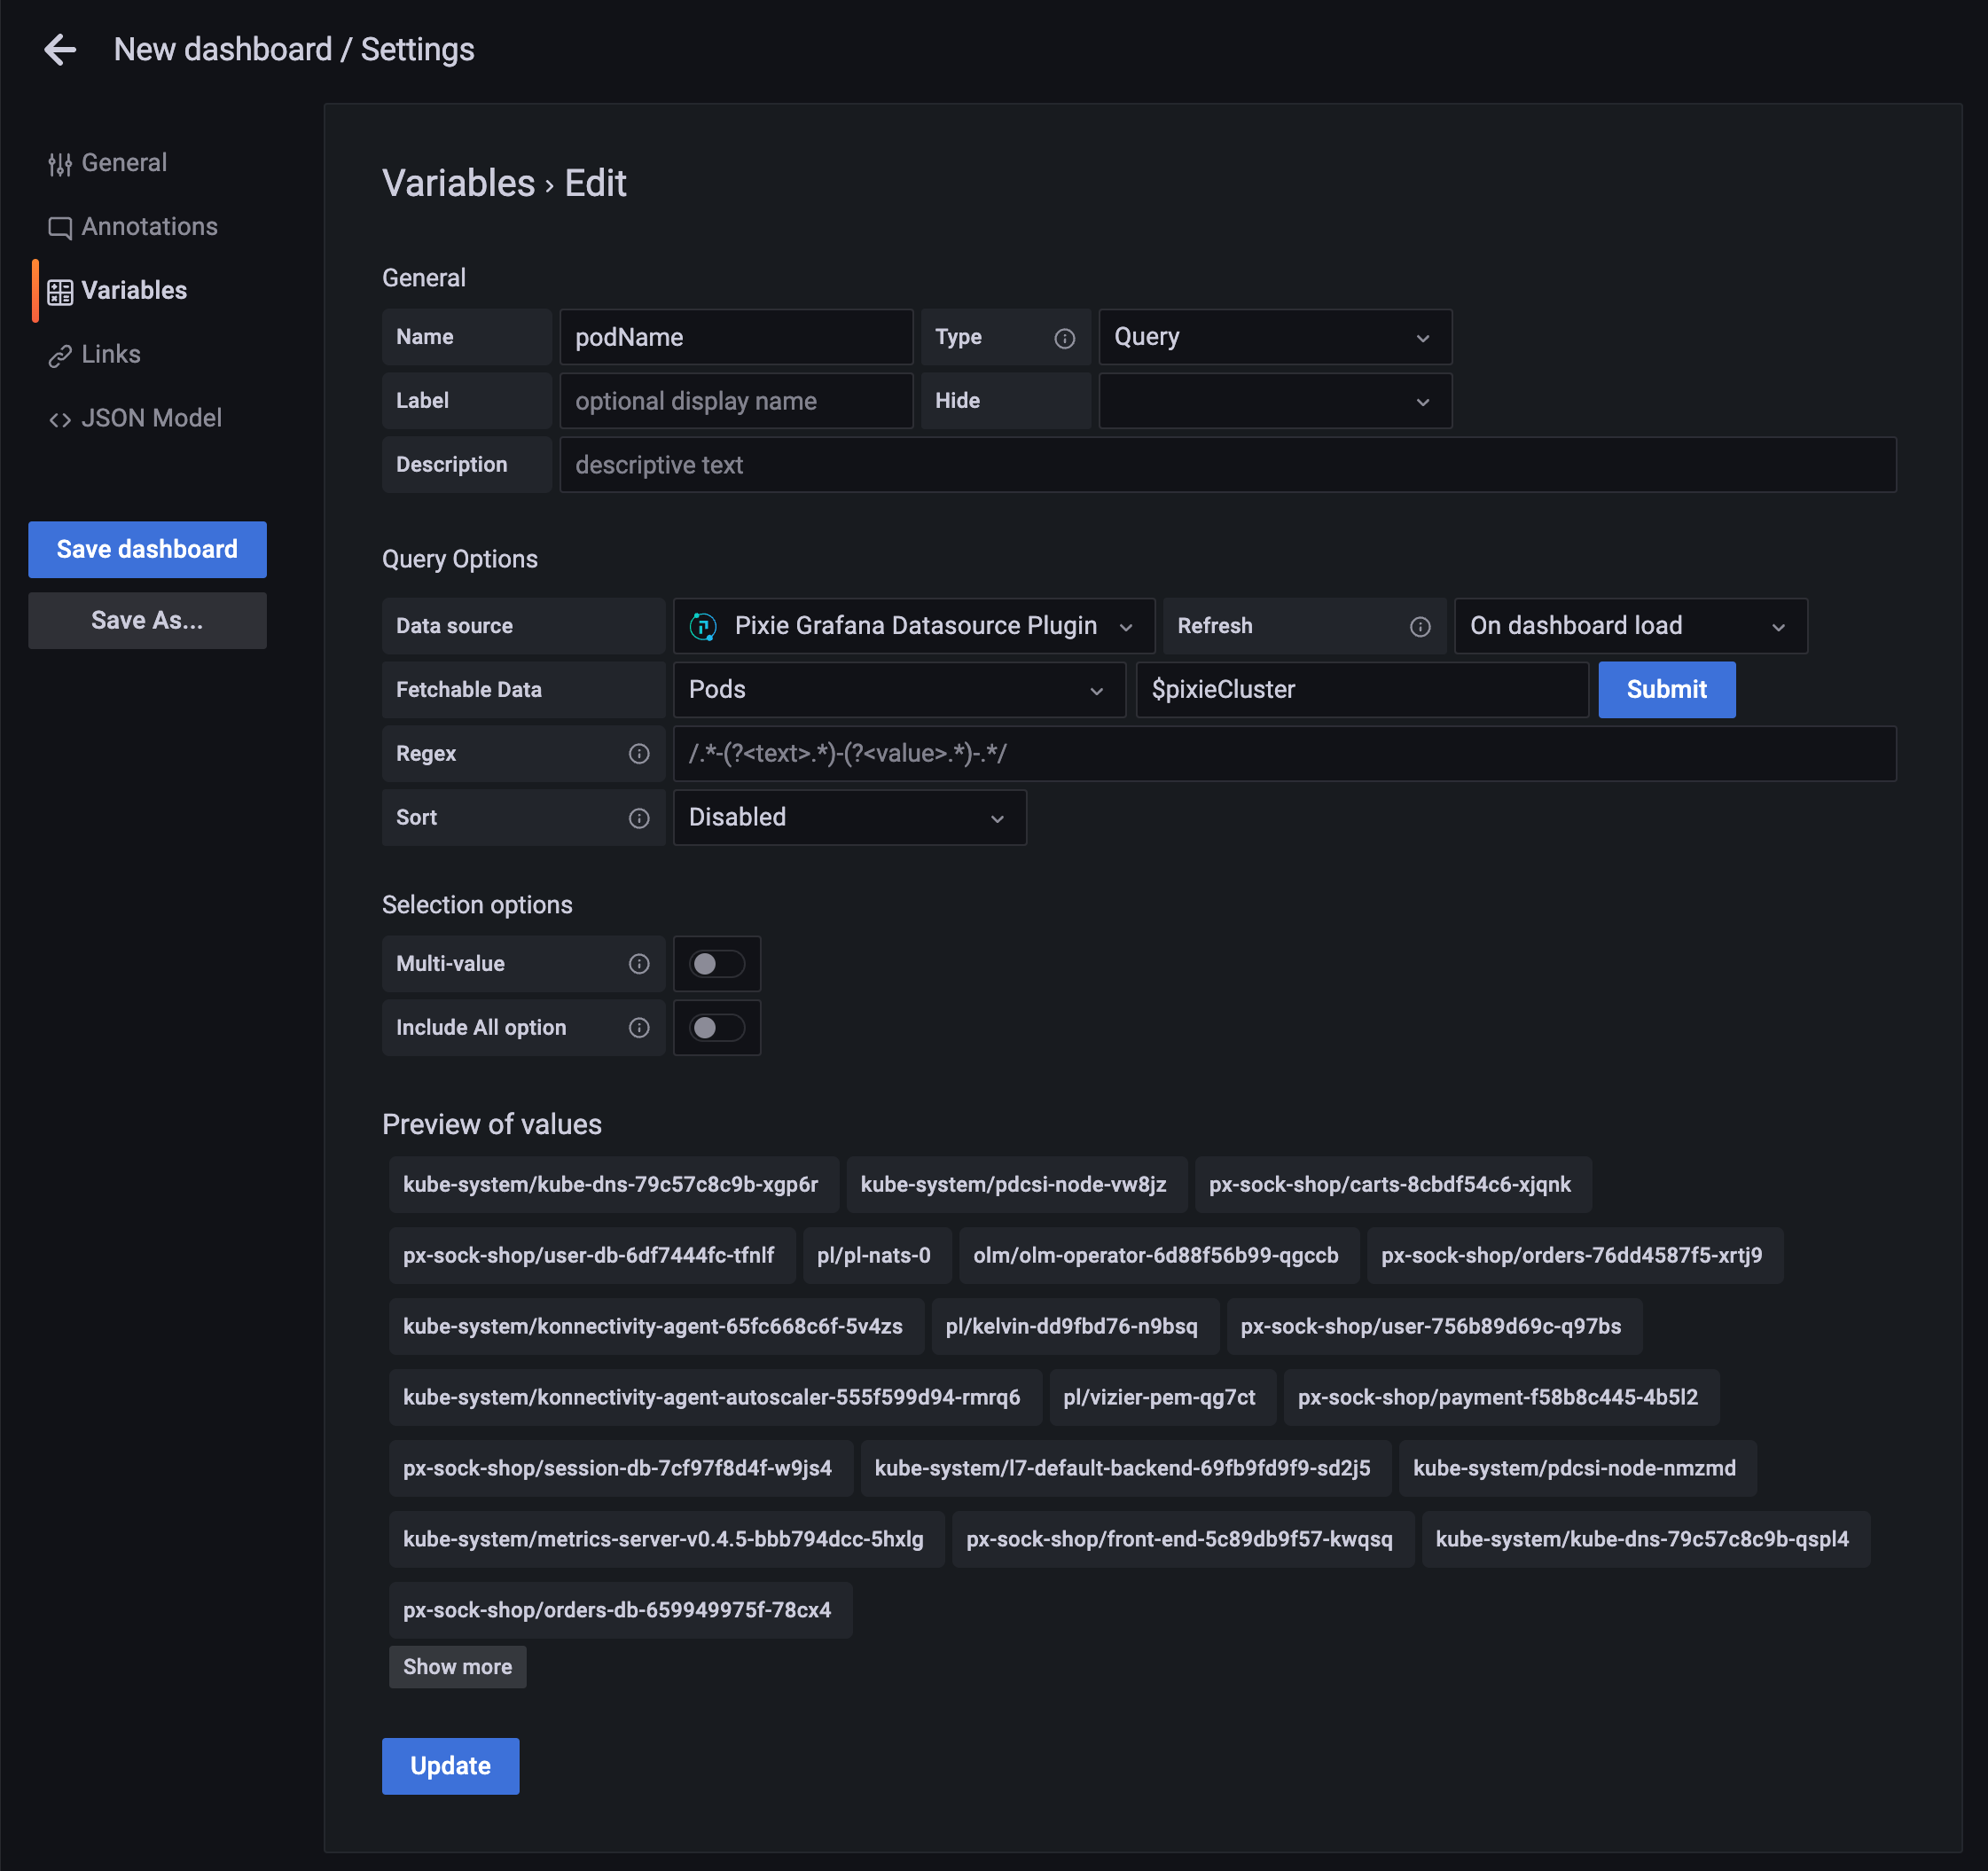
Let's create a new dashboard variable for pod name and use it to filter the HTTP requests:
Following the same steps as above, navigate to the dashboard settings and add a new variable.
Under the General section, name the variable podName.
Under the Query Options section, select Pods for Fetchable Data.
Click the Submit button to preview the pod values.
Click the Update button.
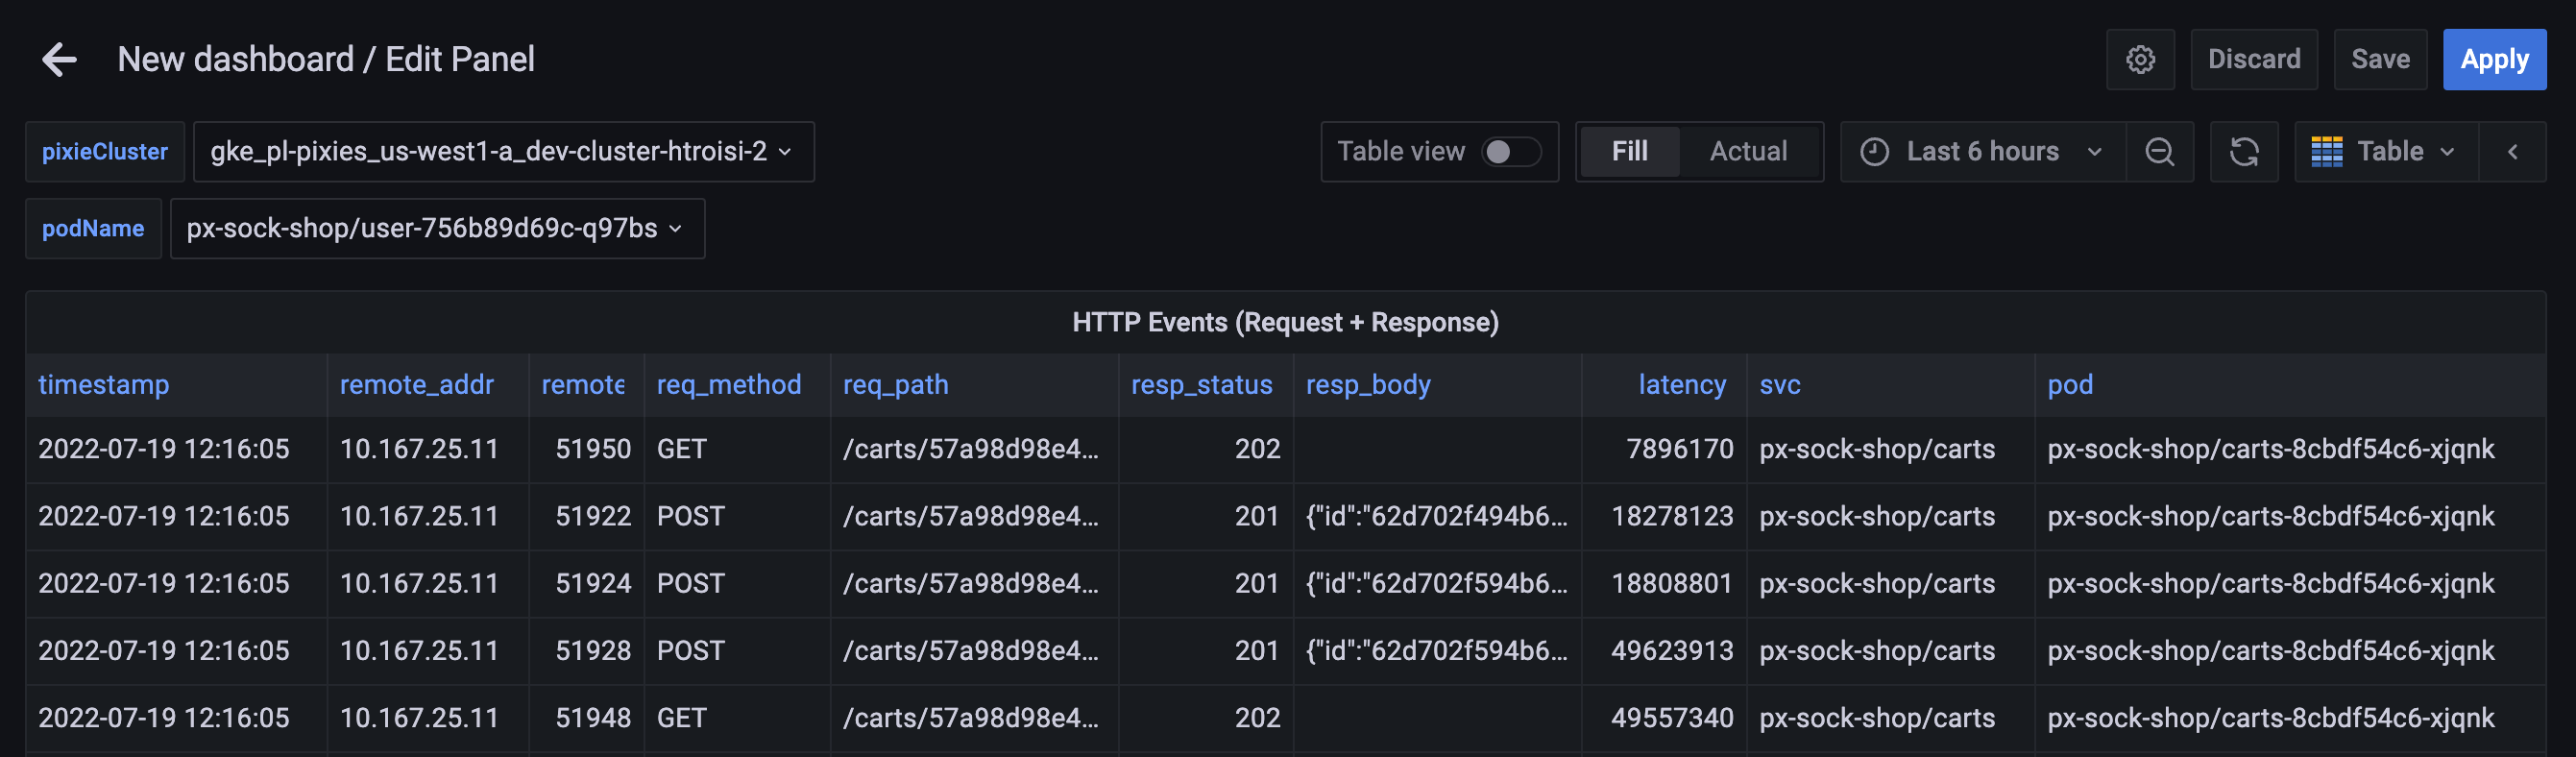
Modify the last few lines of the Raw HTTP Events (Long Format) query script to insert a filter using podName:
# Keep only the selected columns (and order them in the following order)
df = df[[$__columns]]
# Filter HTTP events to only include the ones made to the selected pod
df = df[df.pod =='$podName']
# Output the DataFrame
px.display(df)
Selecting a pod from the podName drop-down menu above the panel will now filter the results to only include HTTP requests made to the selected pod.
More pre-made scripts
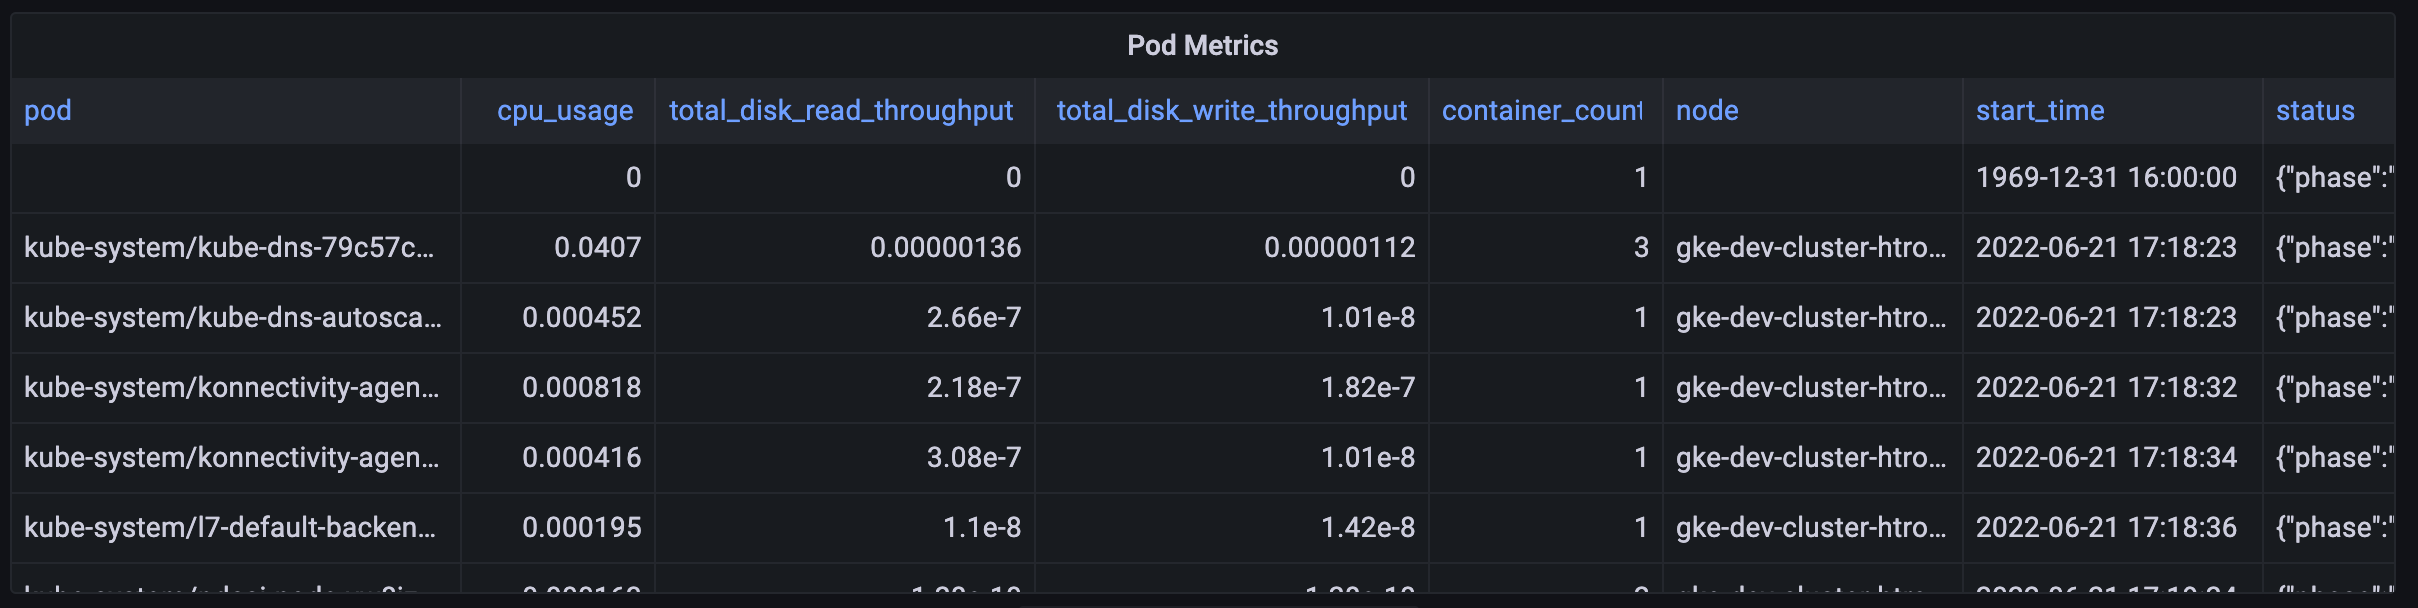
Use the Pod Metrics script to see high-level metrics for each pod in your cluster:
Output of the "Pod Metrics" Pixie Grafana plugin script.
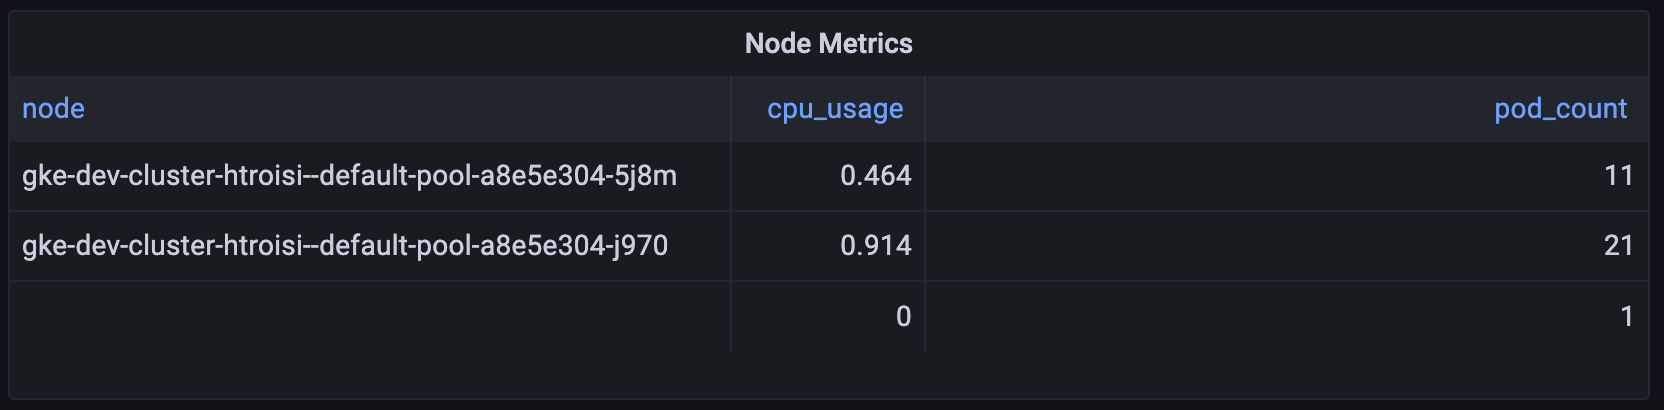
Use the Node Metrics script to see high-level metrics for each node in your cluster:
Output of the "Node Metrics" Pixie Grafana plugin script.
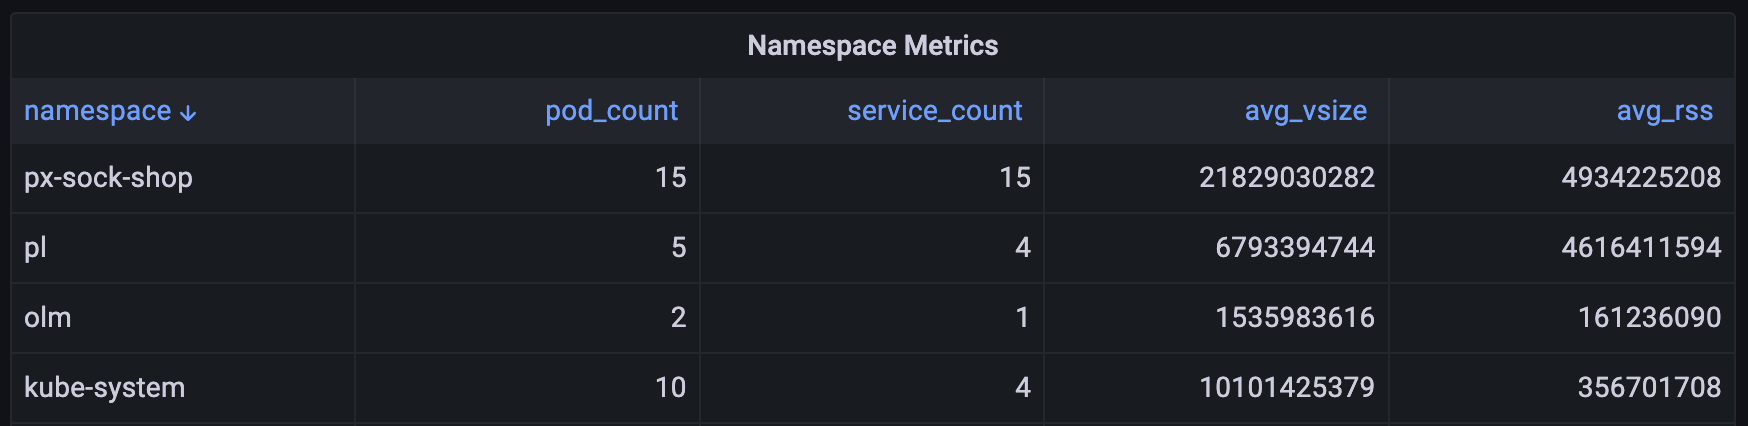
Use the Namespace Metrics script to see high-level metrics for each namespace in your cluster:
Output of the "Namespace Metrics" Pixie Grafana plugin script.
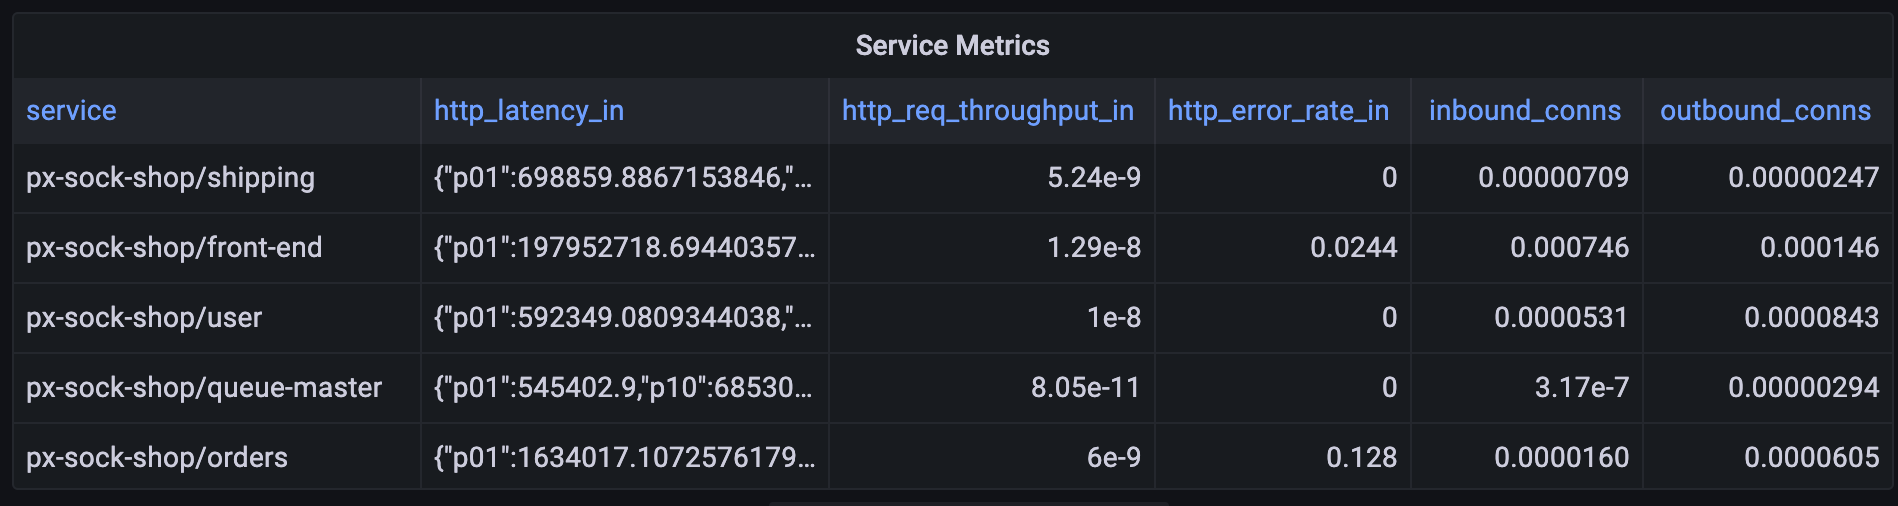
Use the Service Metrics script to see high-level metrics for each service in your cluster:
Output of the "Service Metrics" Pixie Grafana plugin script.
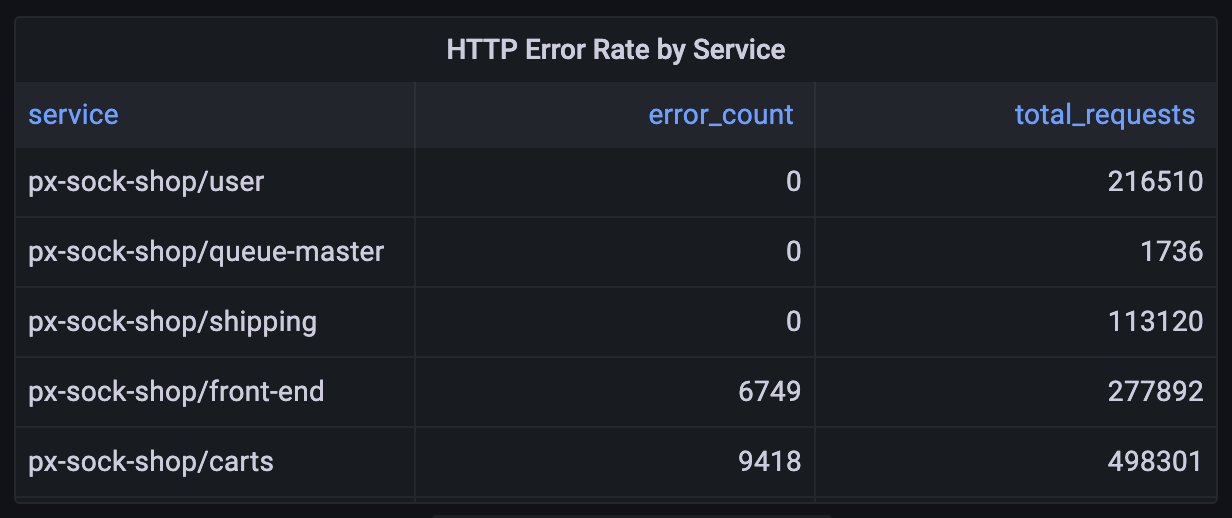
Use the HTTP Error Rate by Service (Wide Format) script to see HTTP error and total request count for each service in your cluster:
Output of the "HTTP Error Rate by Service" Pixie Grafana plugin script.
Use the Raw HTTP Requests script to see overall HTTP request throughput for your cluster:
Output of the "Raw HTTP Requests" Pixie Grafana plugin script.
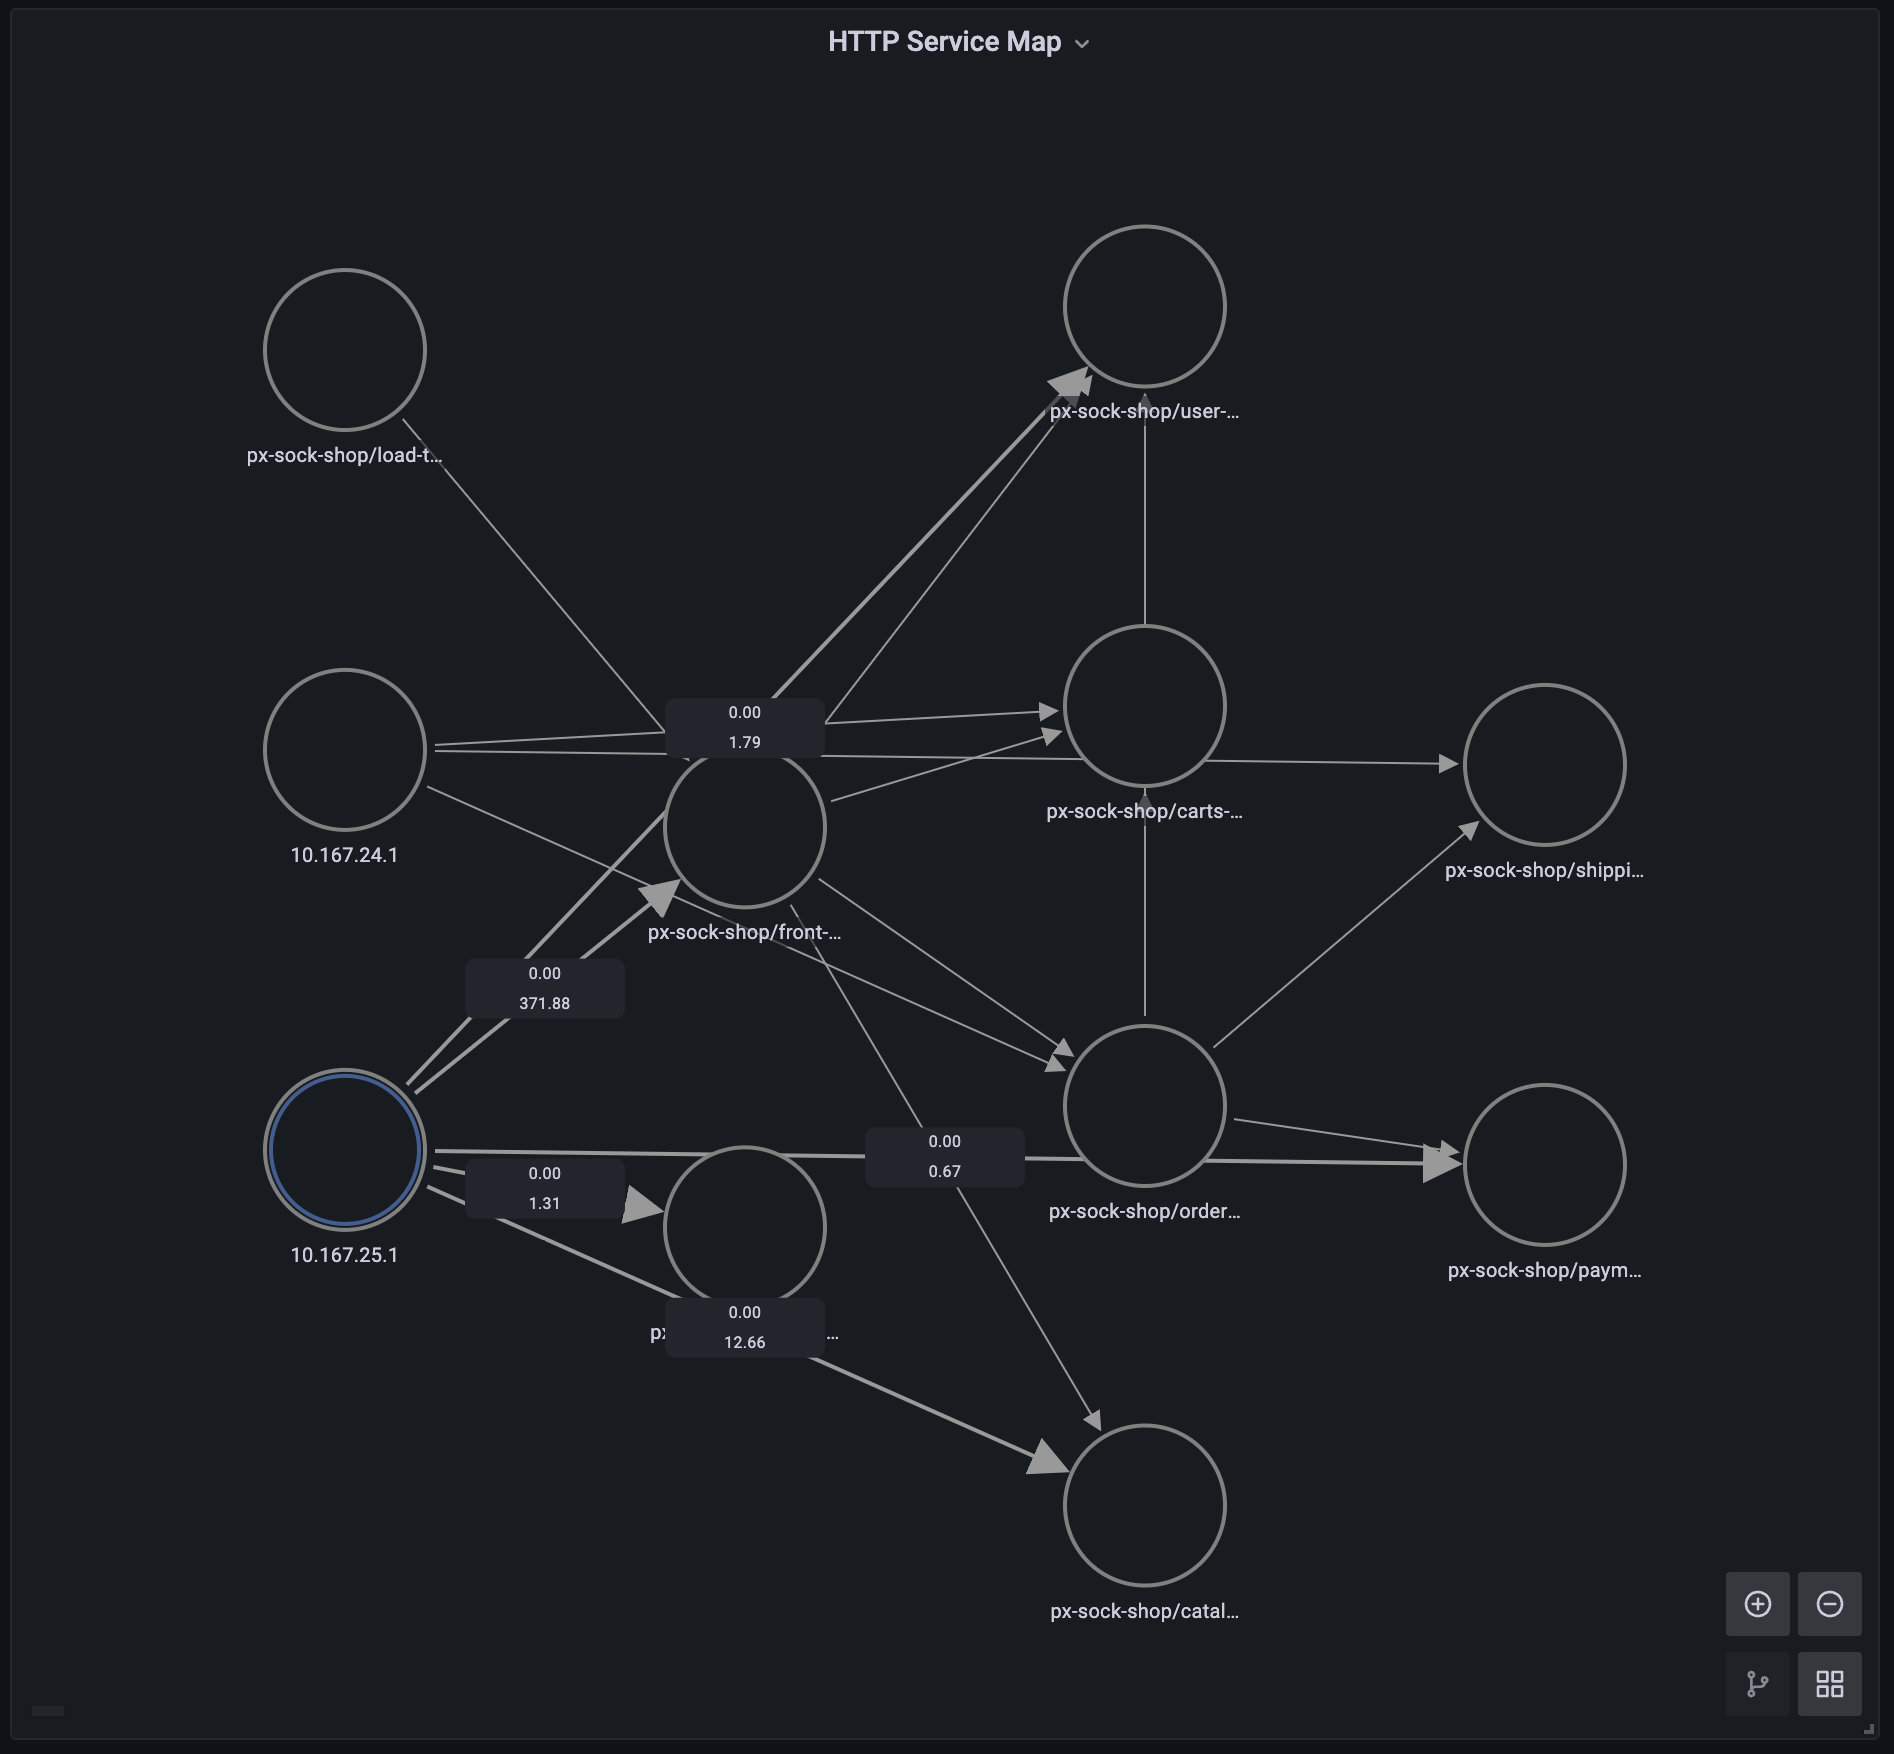
Use the HTTP Service Graph script to see a graph of the HTTP requests in your cluster. Note: this node graph panel requires Grafana version 8.0.0+.
Output of the "HTTP Service Graph" Pixie Grafana plugin script.
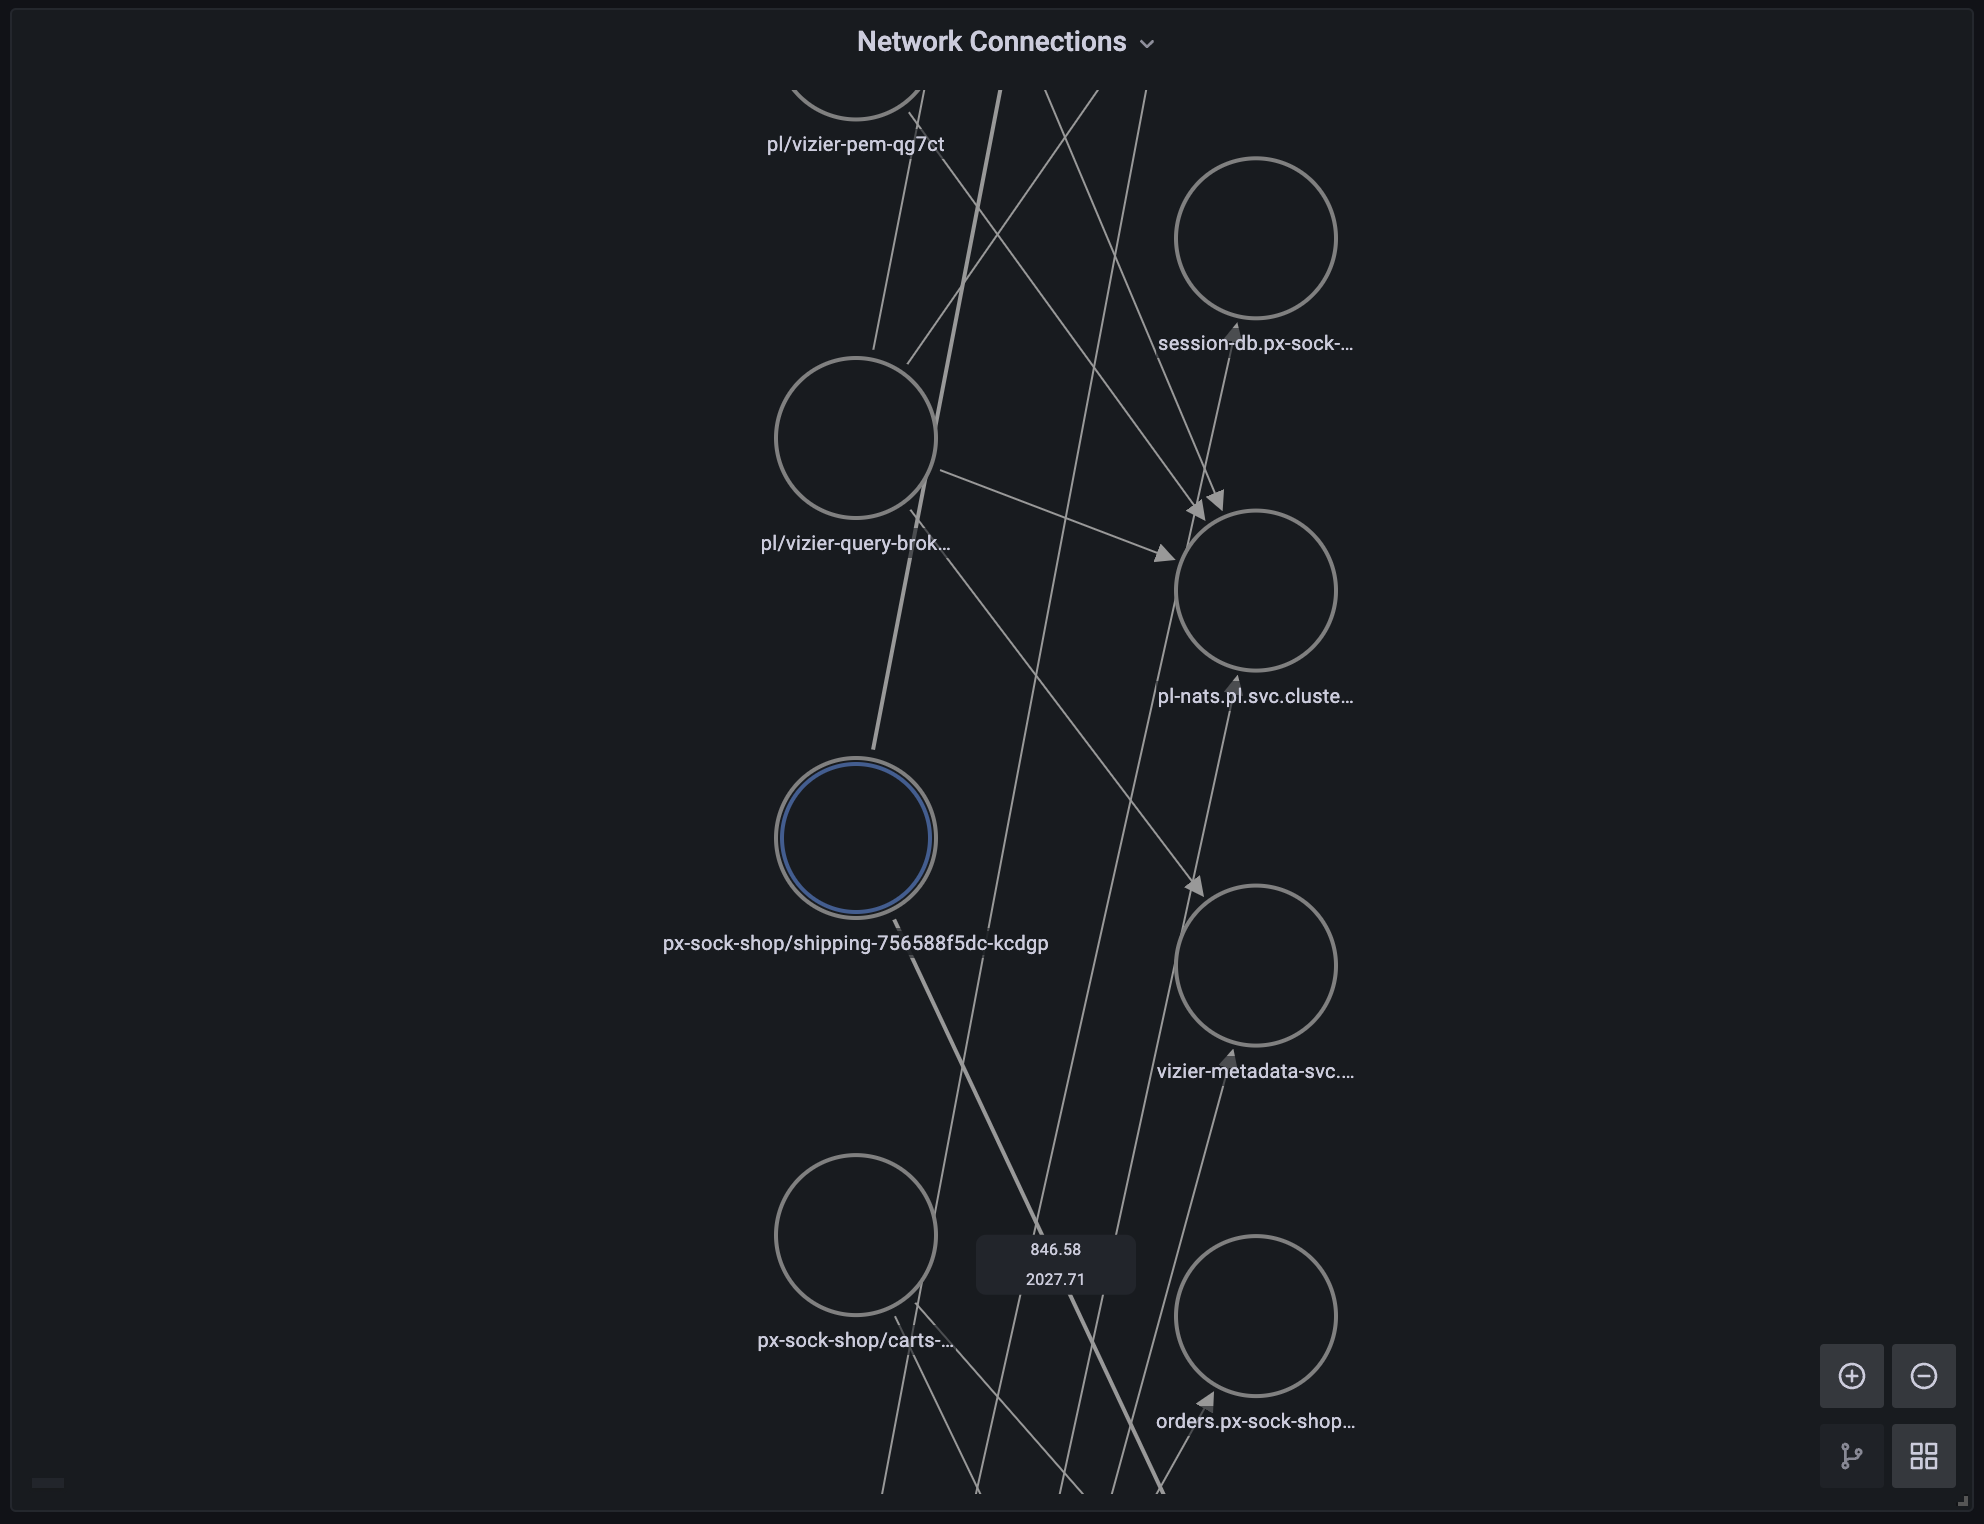
Use the Network Connections script to see network connections to, from, and within your cluster. Note: this node graph panel requires Grafana version 8.0.0+.
Output of the "Network Connections" Pixie Grafana plugin script.
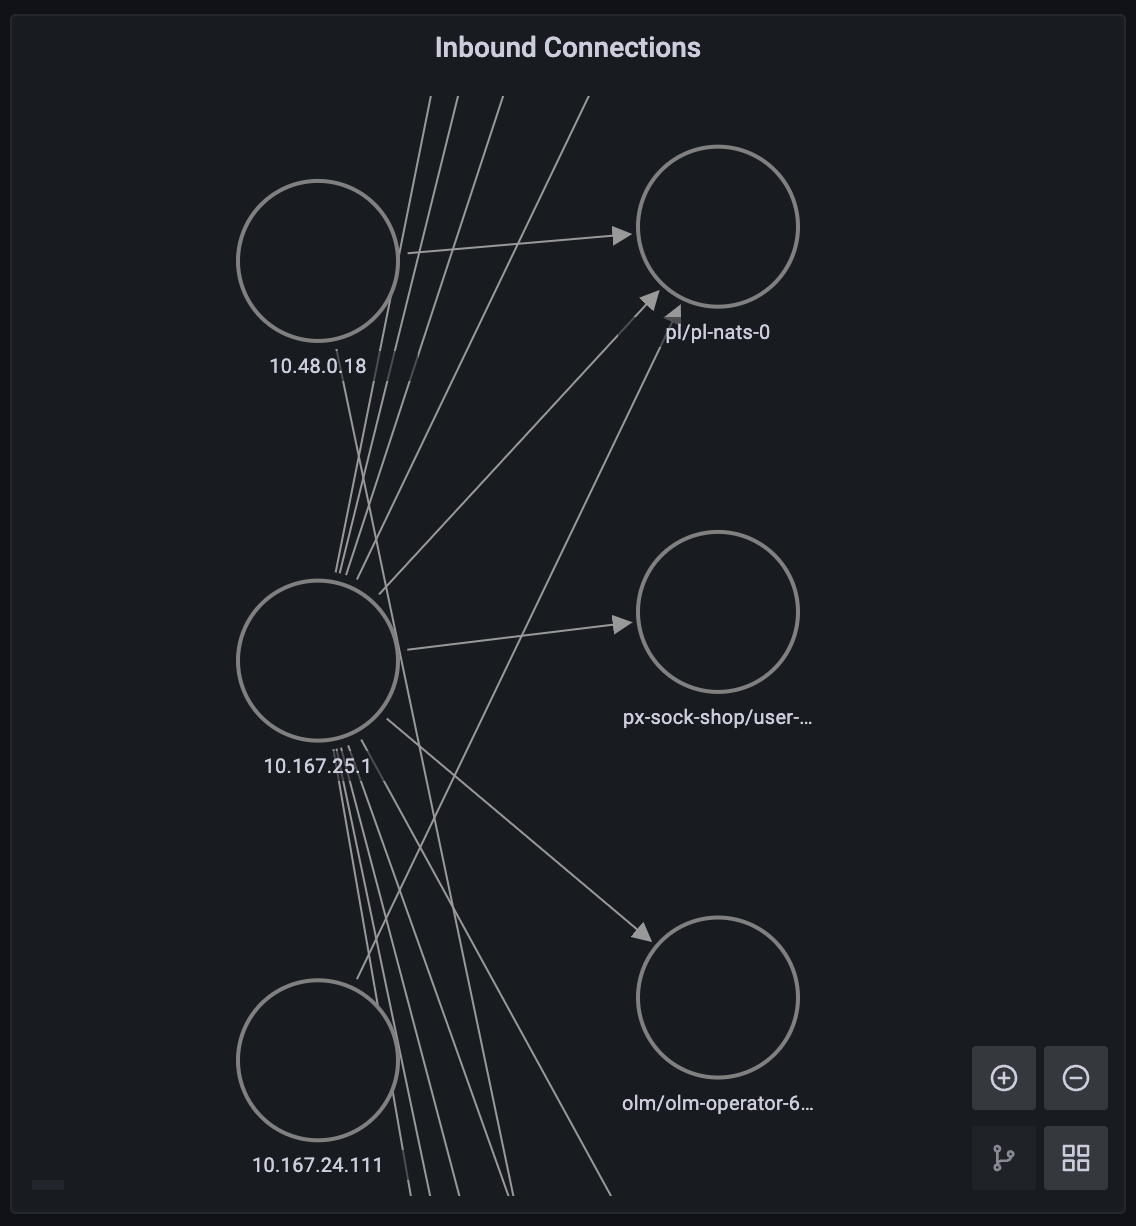
Use the Inbound Connections script to see inbound network connections to your cluster (connections made from external IPs). Note: this node graph panel requires Grafana version 8.0.0+.
Output of the "Inbound Connections" Pixie Grafana plugin script.
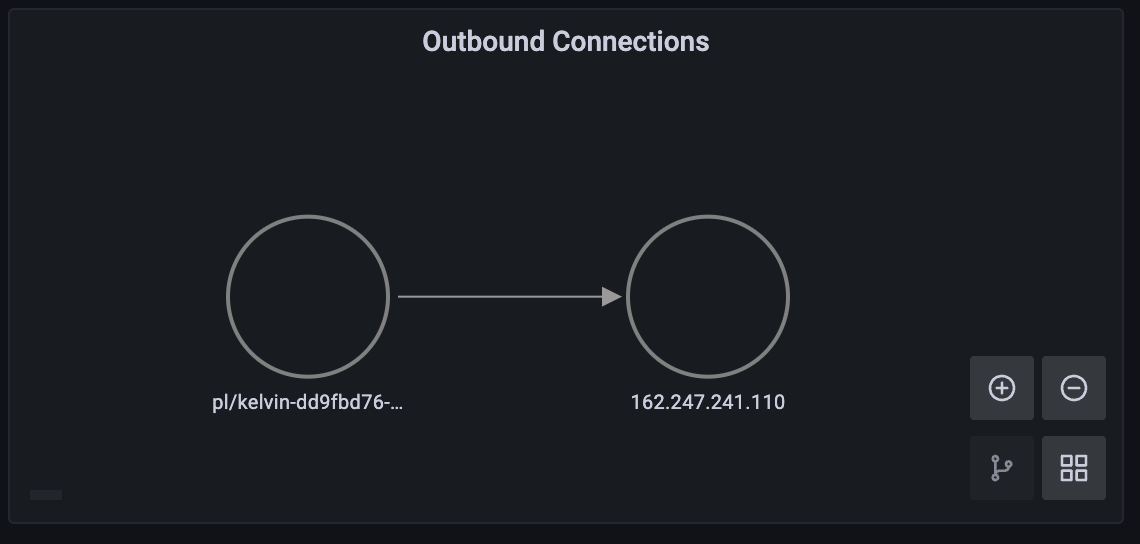
Use the Outbound Connections script to see outbound network connections from your cluster (connections made to external IPs). Note: this node graph panel requires Grafana version 8.0.0+.
Output of the "Outbound Connections" Pixie Grafana plugin script.
When writing a custom script, it's often easiest to modify an existing script instead of starting from scratch. Start by identifying one of the pre-made scripts or dashboards that does something similar to what you're looking for. The Script selector in the Query editor tab shows descriptions for each pre-made script.
Once you've identified a script that does something similar to what you are aiming to do, edit the script and refresh the panel.
Switching to the Table visualization to make sure that the query is returning some sort of data in table form.
Making sure that your cluster has HTTP traffic that Pixie can automatically trace. Instructions for installing a demo application with HTTP traffic can be found here. If you're using your own application, double check that Pixie supports the protocols for the traffic in your cluster.
Get Help
Check out the Pixie Grafana datasource plugin reference docs.
Inspect the source code, report issues, and contribute fixes in the GitHub repo.
Ask questions in the #grafana-plugin channel on Pixie's Community Slack.