Resource pressure can impact the health of your services, but it can be hard to correlate with application performance. With Pixie, you can easily monitor your infrastructure alongside your network and application layers.
This tutorial will demonstrate how to use Pixie to:
Monitor resource usage by Node and Pod.
Easily navigate between Kubernetes resources within the Pixie UI.
Prerequisites
You will need a Kubernetes cluster with Pixie installed. If you do not have a cluster, you can create a minikube cluster and install Pixie using one of our install guides.
Resource Usage by Node
Let’s use the px/nodes script to get high-level resource usage information for all of the nodes in our cluster:
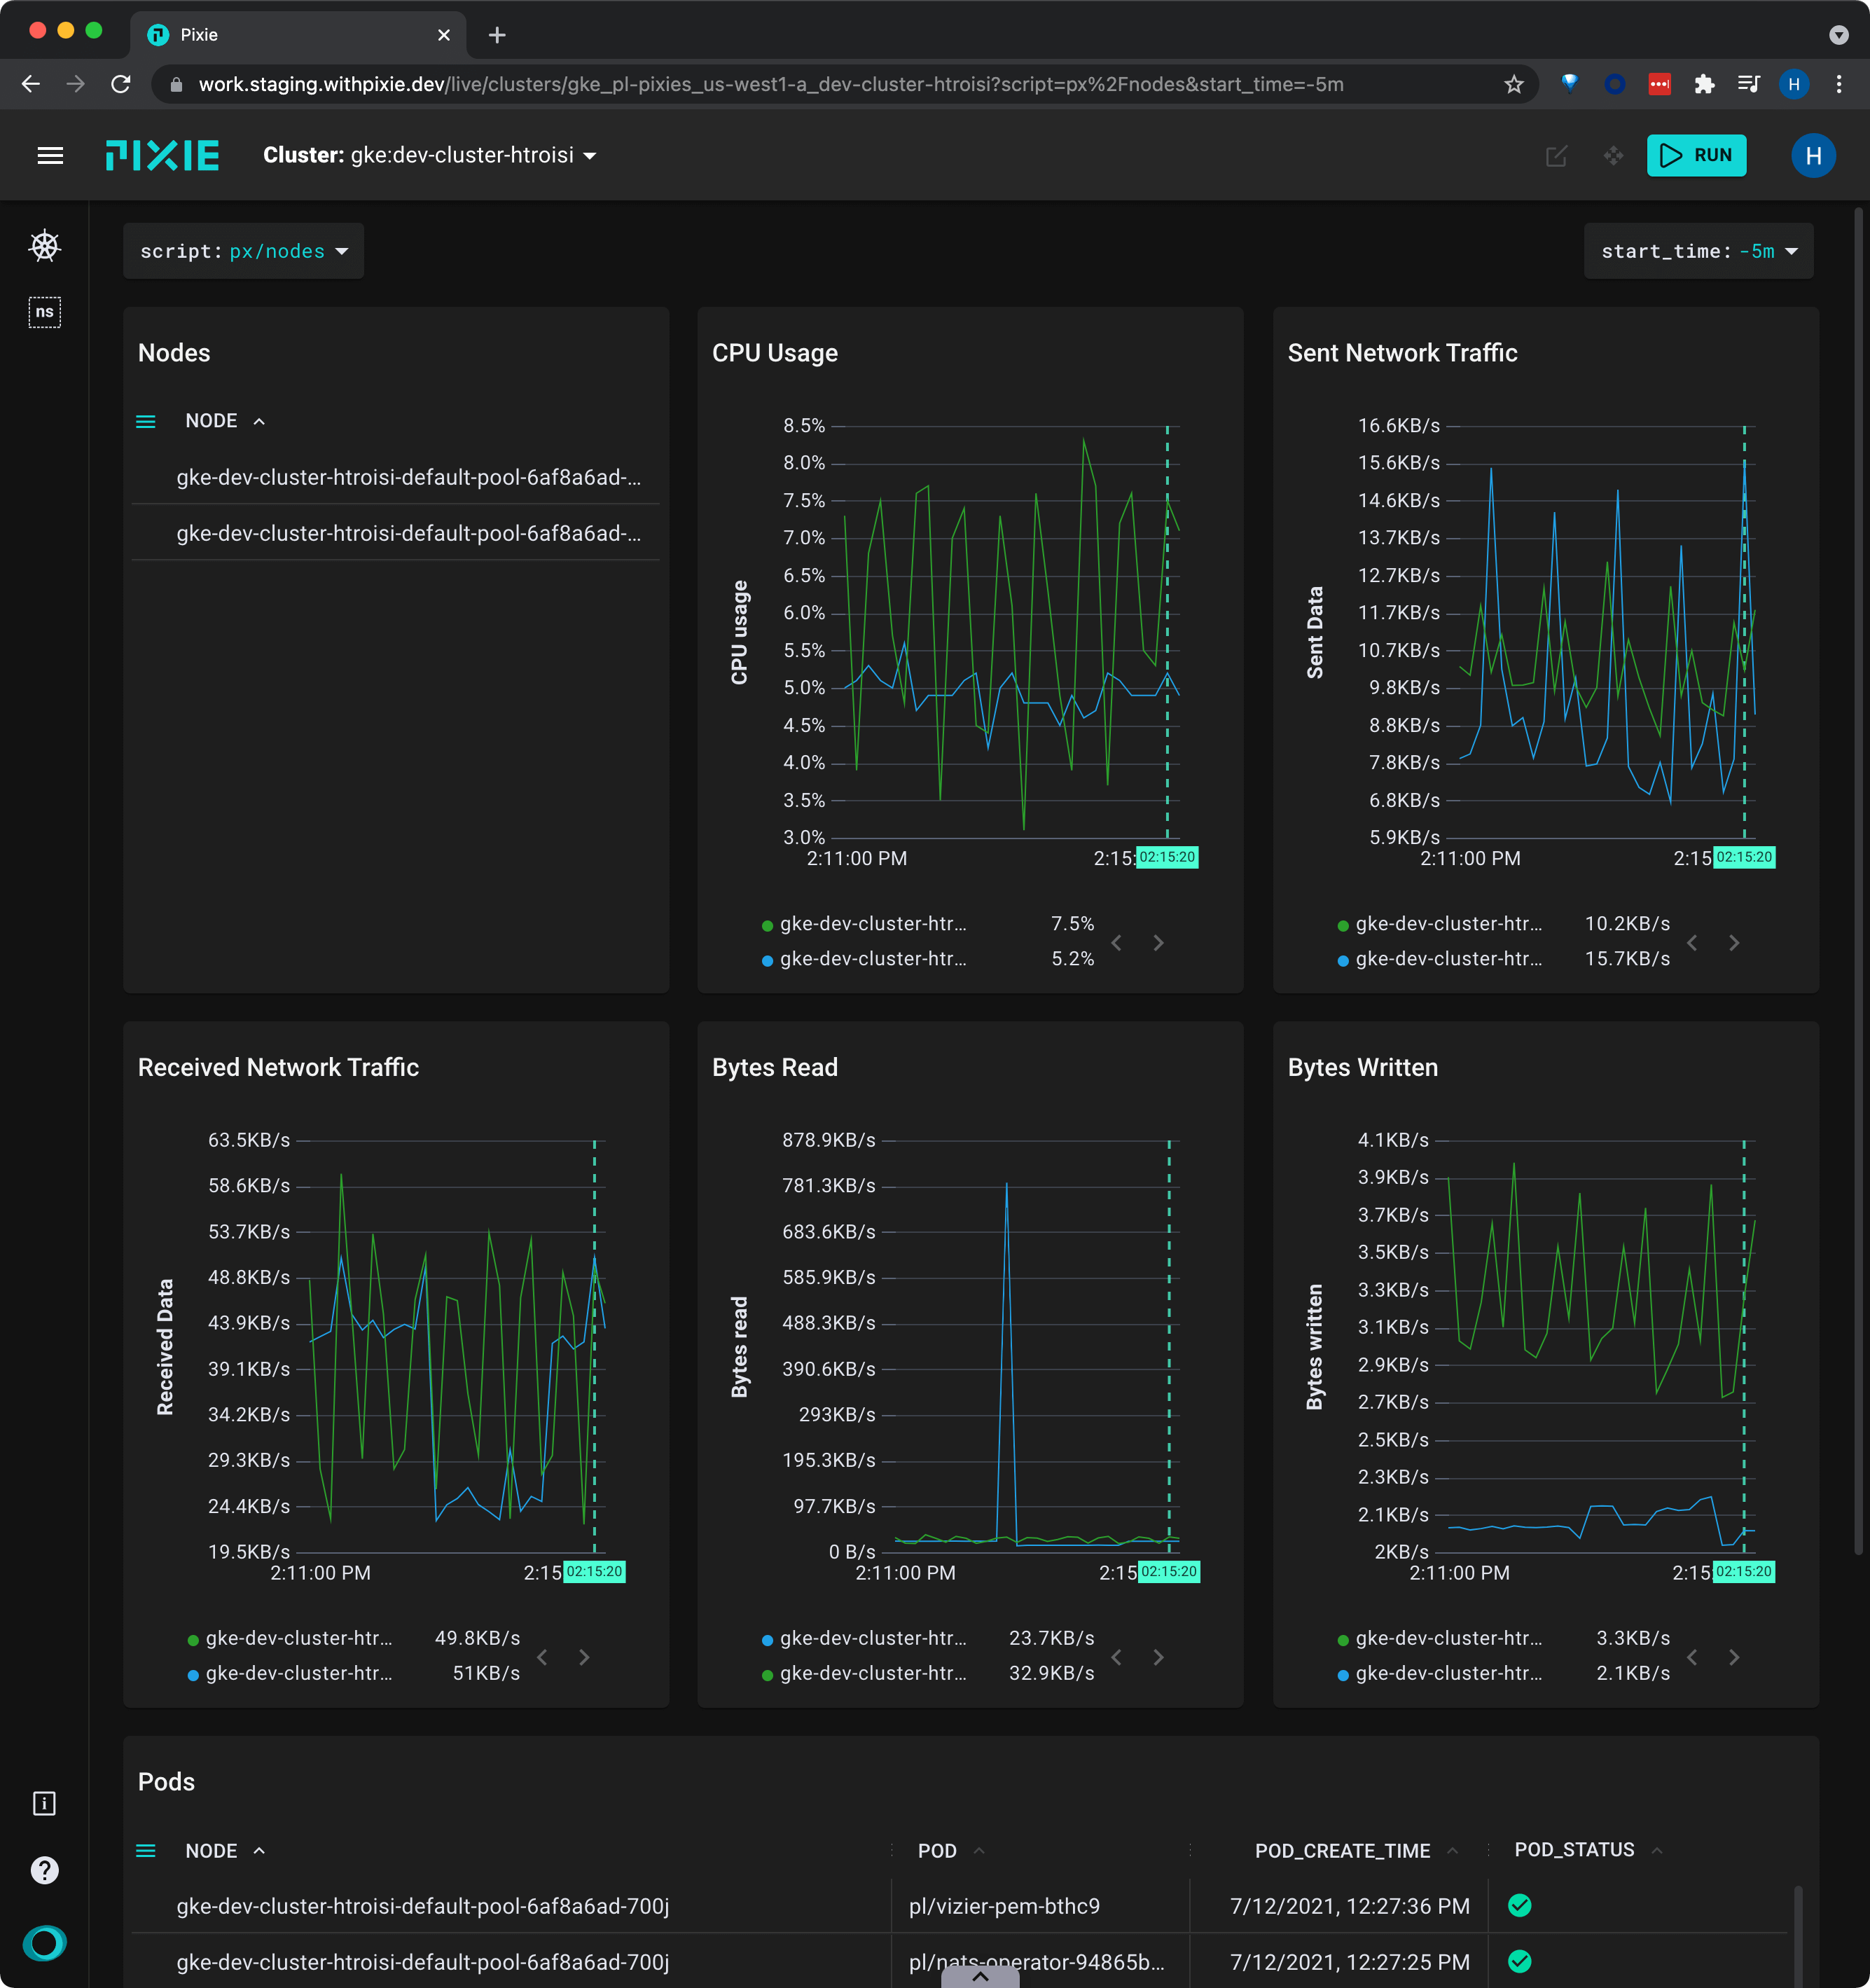
Open the Live UI and select px/nodes from the script drop-down menu at the top.
This script lists all of the nodes in the cluster along with their CPU usage, memory consumption, and network traffic stats. It also displays a list of pods that were on each node during the time window.
Click on K8s entities to be taken to an overview of that resource.
Click a legend item to highlight those specific results. Click the item a second time to show all results.
Drag your mouse across the graph to see the values at particular timestamps.
Hover over the flashing blue circles on the image above to see tips about this graph.
Pixie's UI makes it easy to quickly navigate between Kubernetes resources. Clicking on any pod, node, service, or namespace name in the UI will open a script showing a high-level overview for that entity.
Click on the name of a node in the top left Nodes table to follow the deep link to the px/node script for that node. This script may take a few seconds to execute.
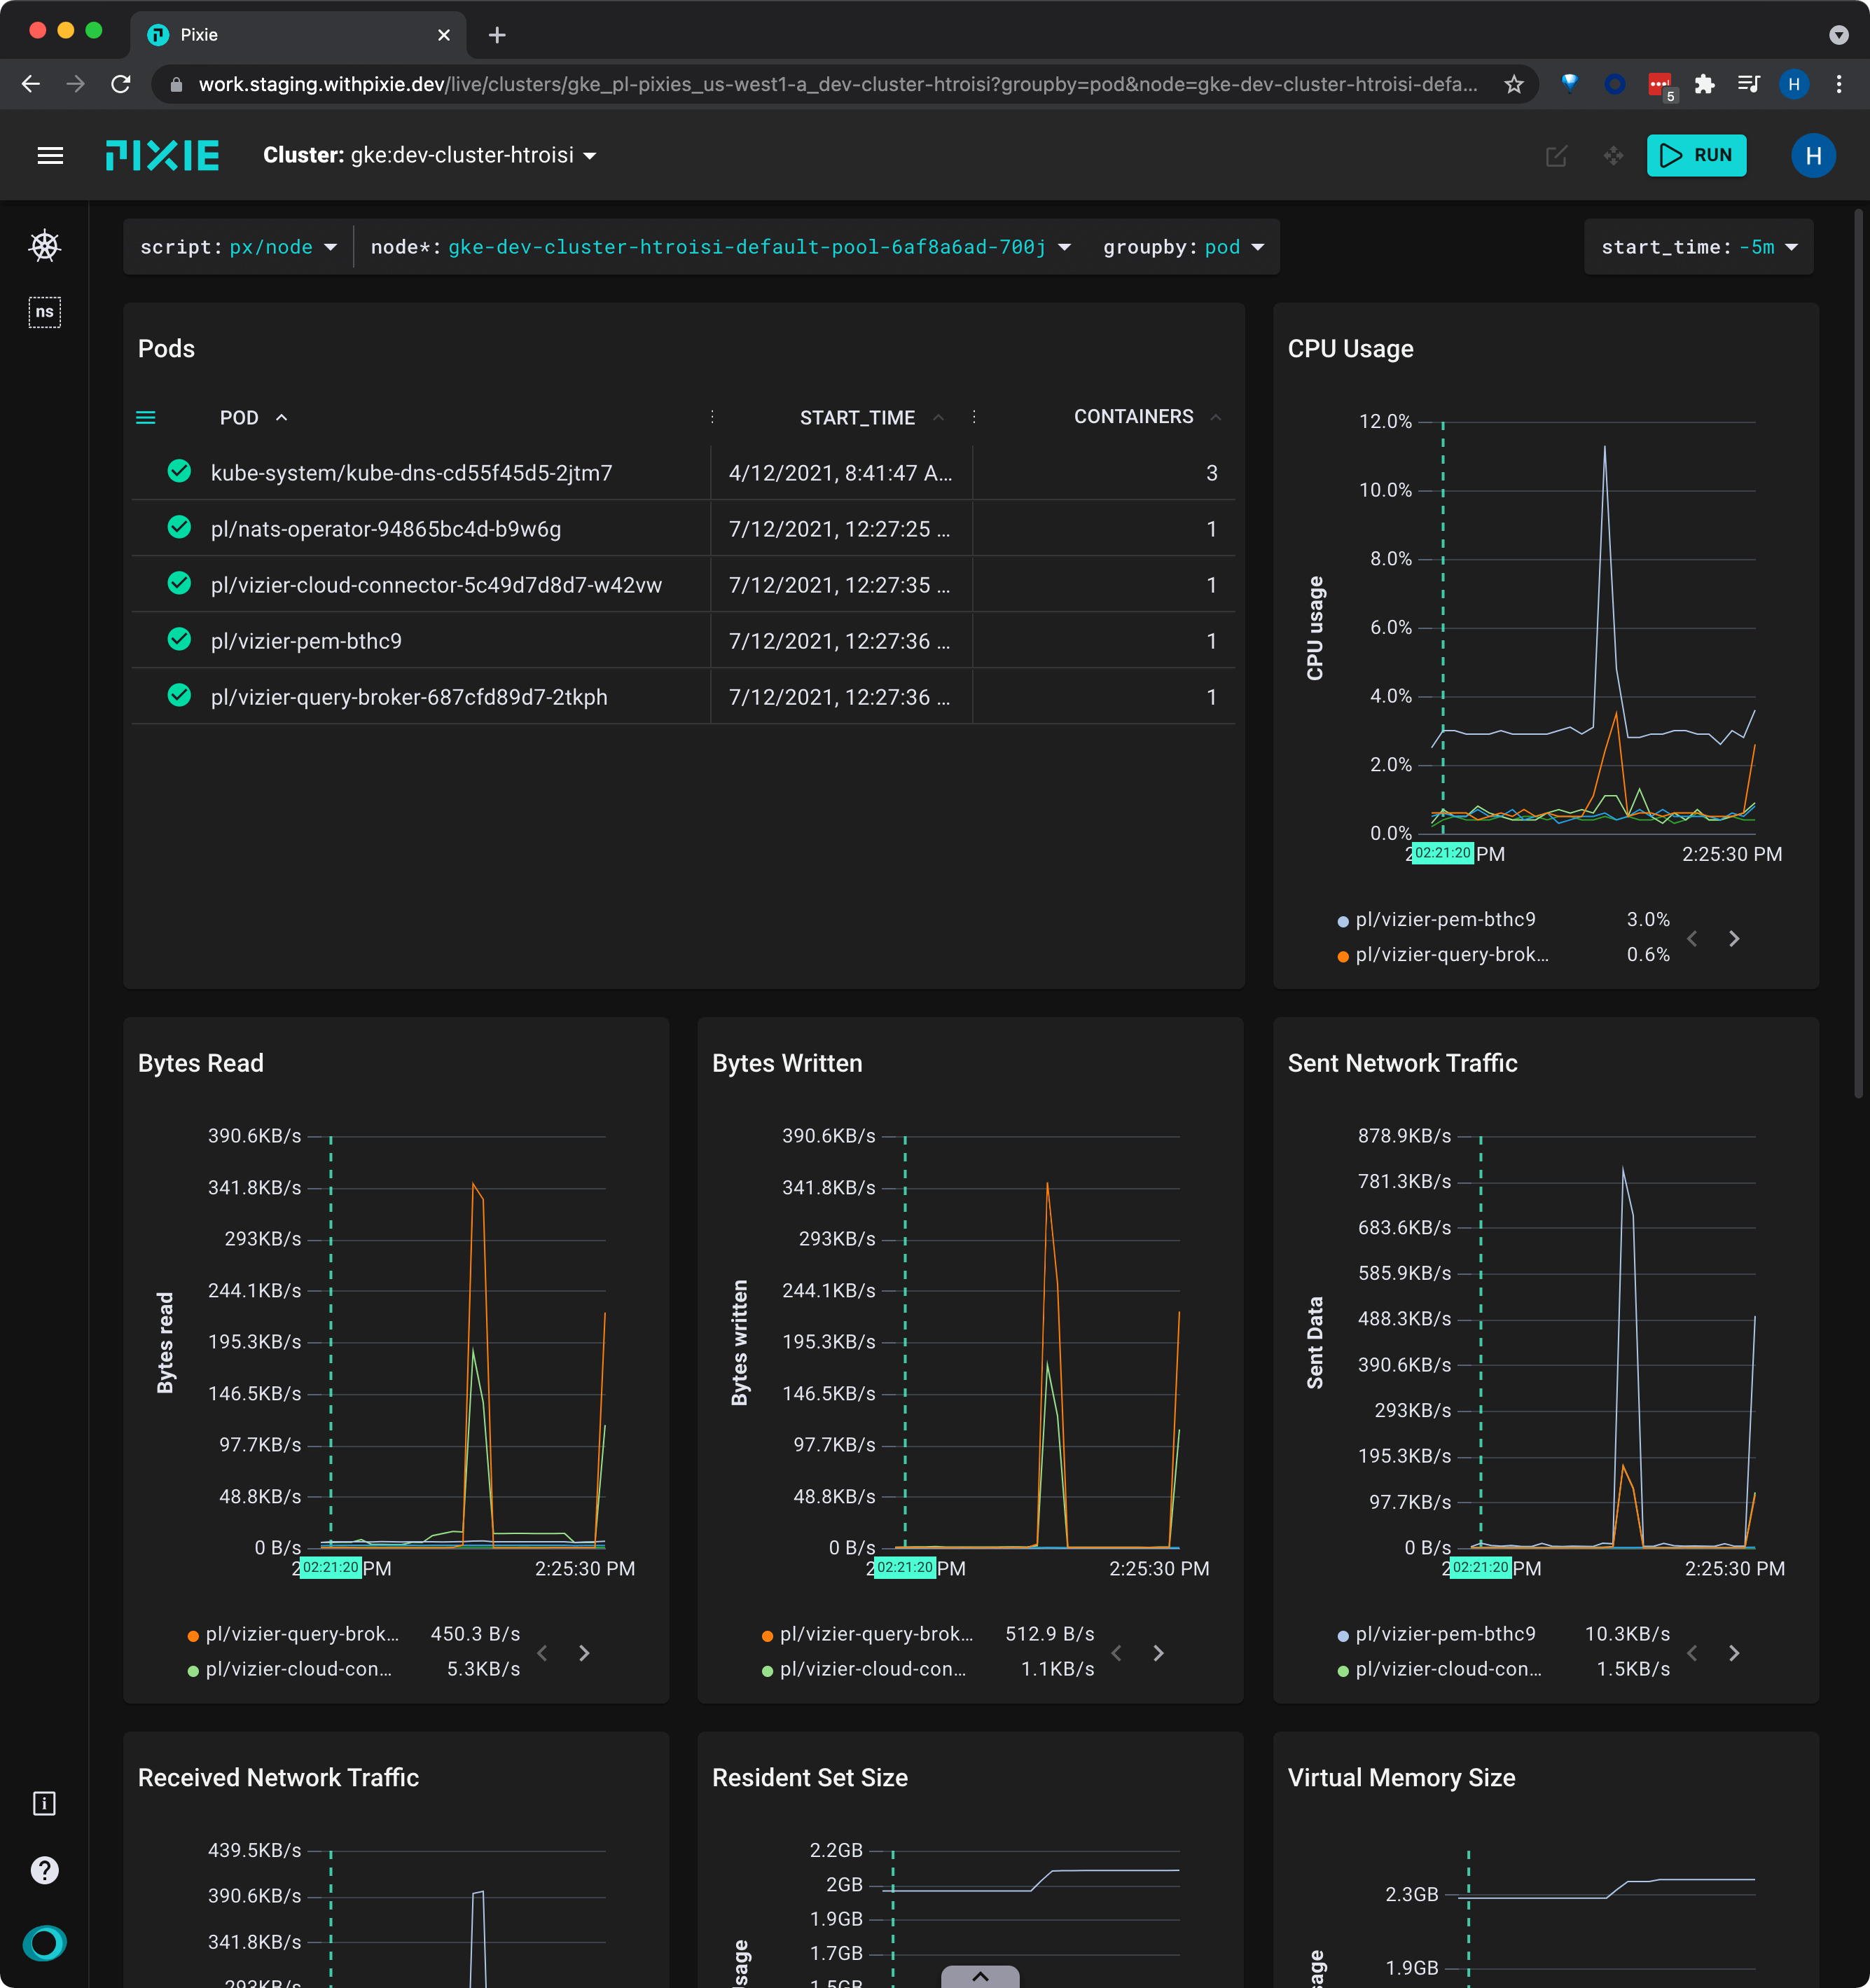
The px/node script shows a similar set of information - CPU usage, memory usage, and network traffic - but just for the selected node.
Notice that the script's required node argument has been filed out for you. If you had navigated to this script directly, using the script drop-down menu, you would have needed to provide a node name before seeing results.
Click on the drop down arrow by the groupby argument at the top and select "pod". The graphs will update to display the information grouped by pod instead of node.
The px/node script contains a list of the pods on the node in the top left Pods table.
Resource Usage by Pod
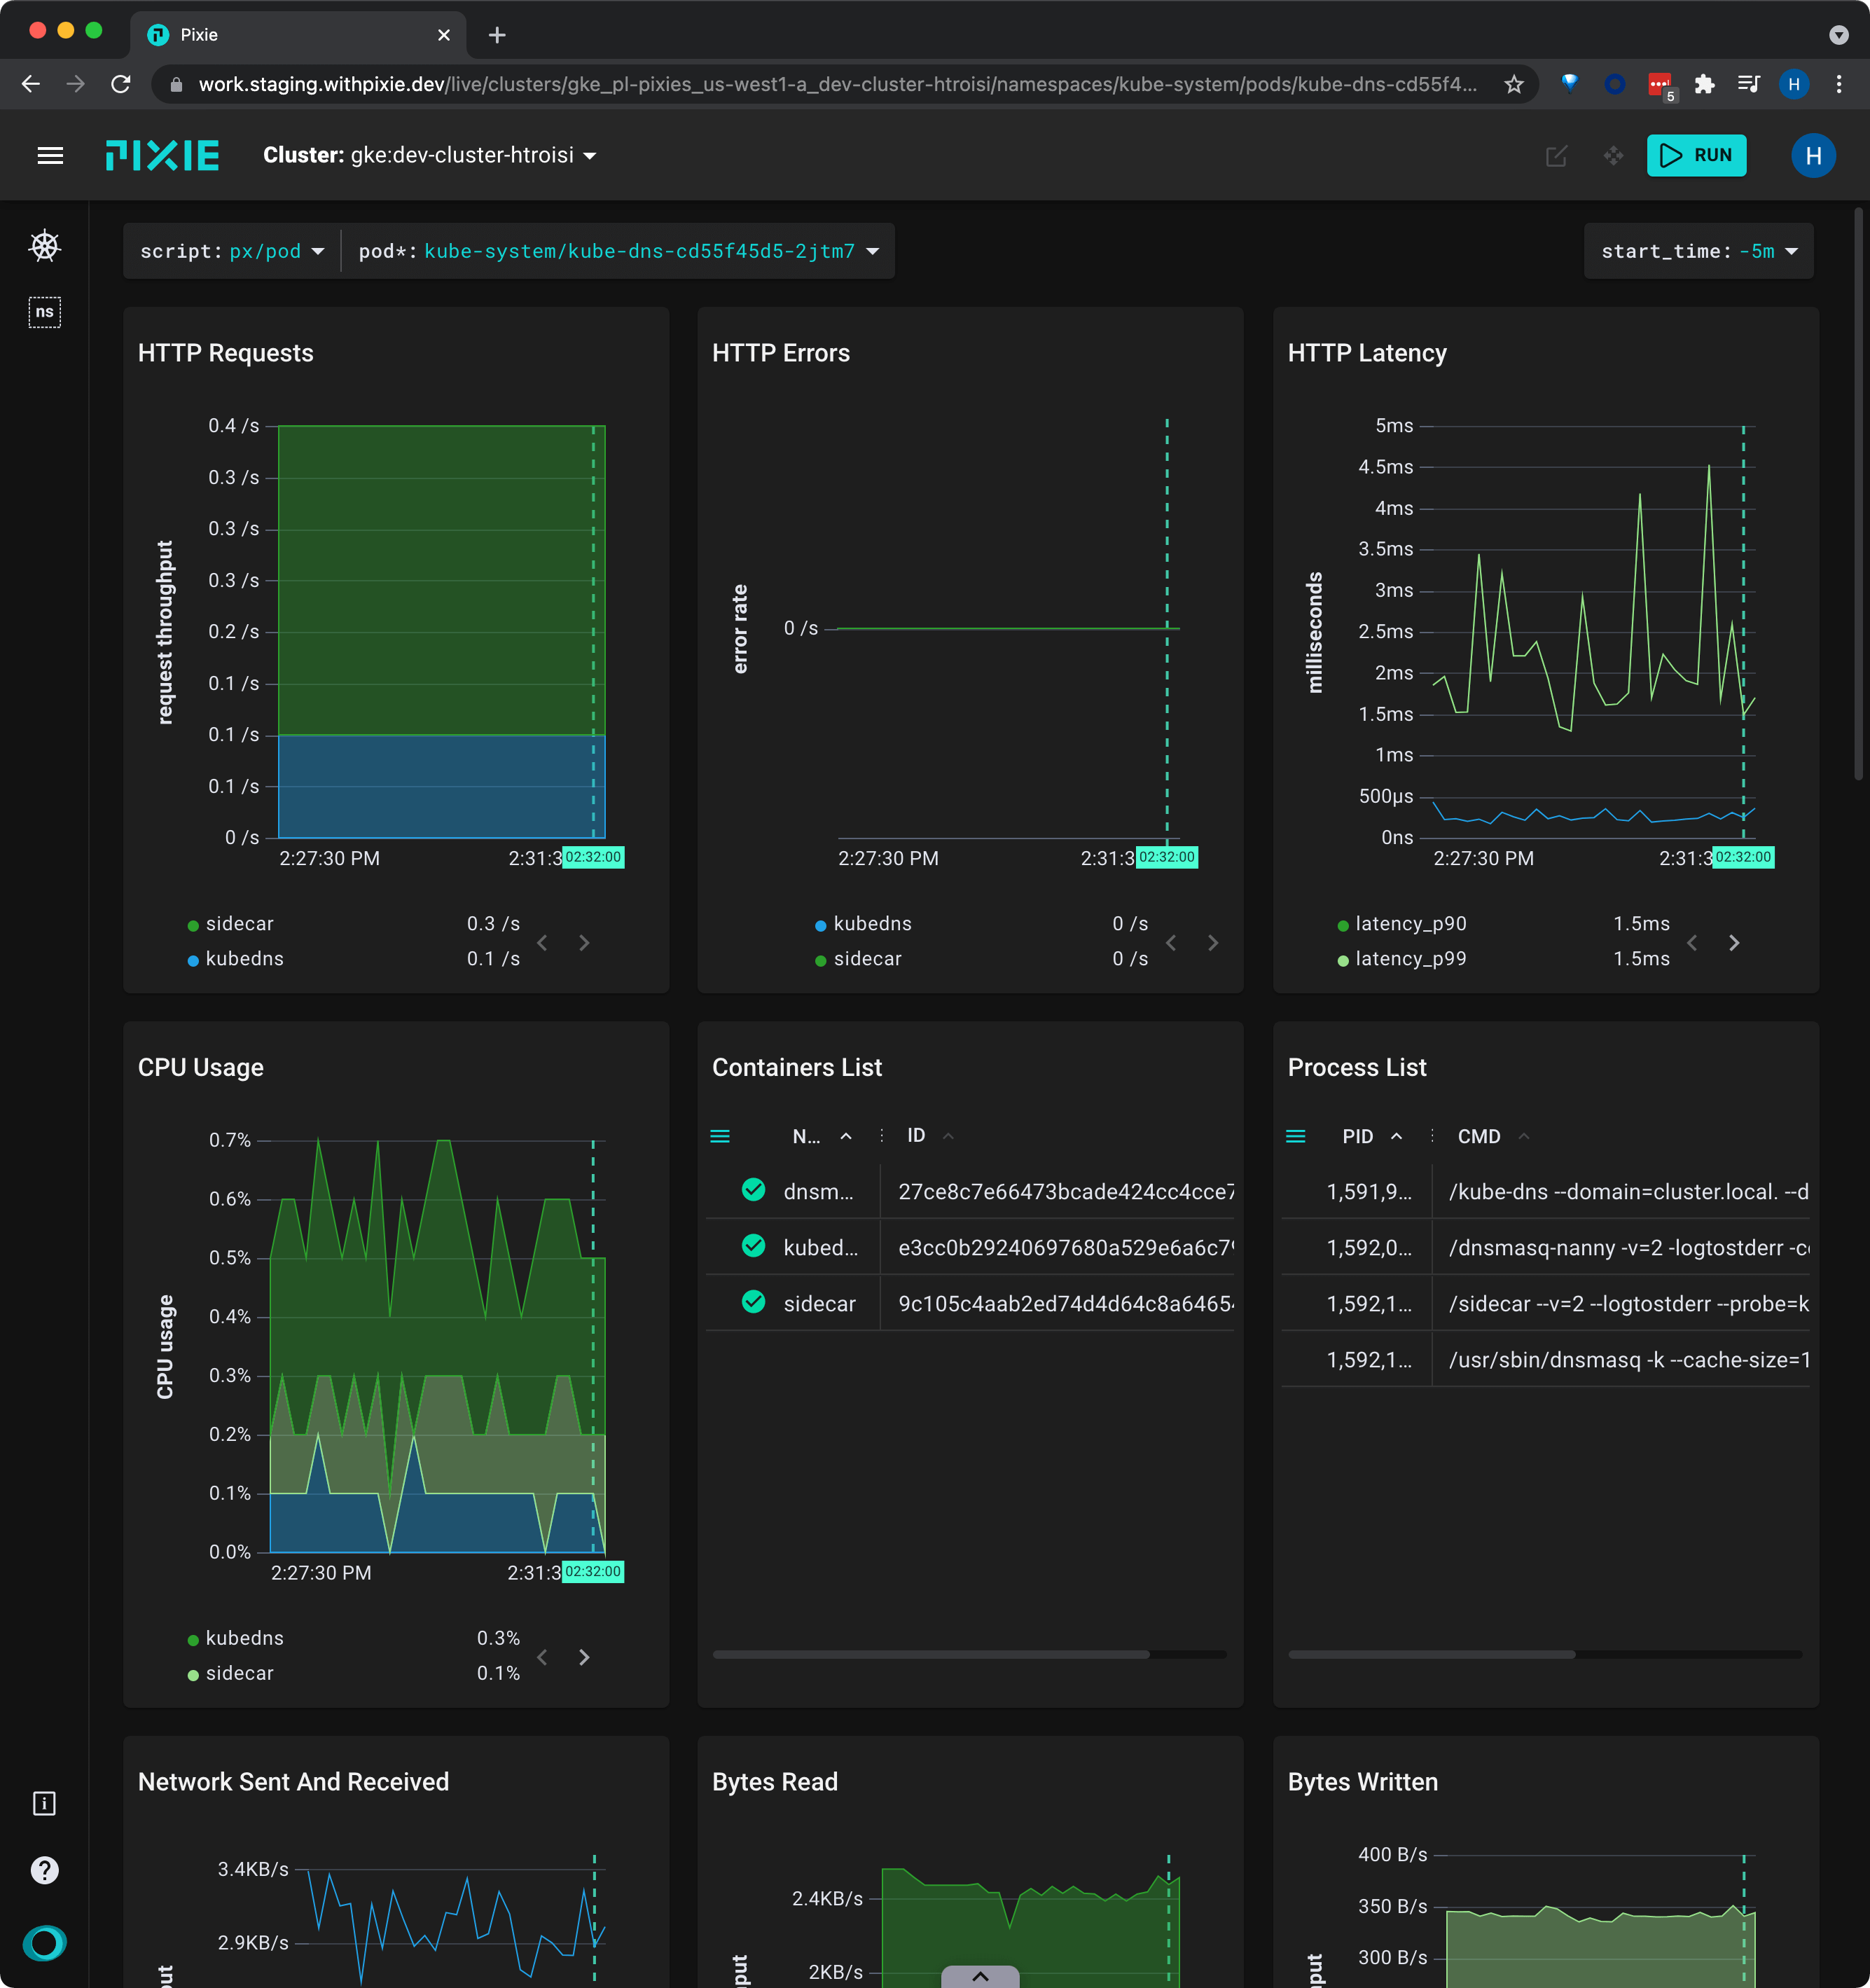
Click on the name of a pod in top left Pods table. This takes you to the px/pod script. This script may take a few seconds to execute.
The px/pod shows an overview of the specified pod, including high-level HTTP application metrics, and resource usage. It also lists containers on the pod, all live processes, inbound HTTP traffic, and more.
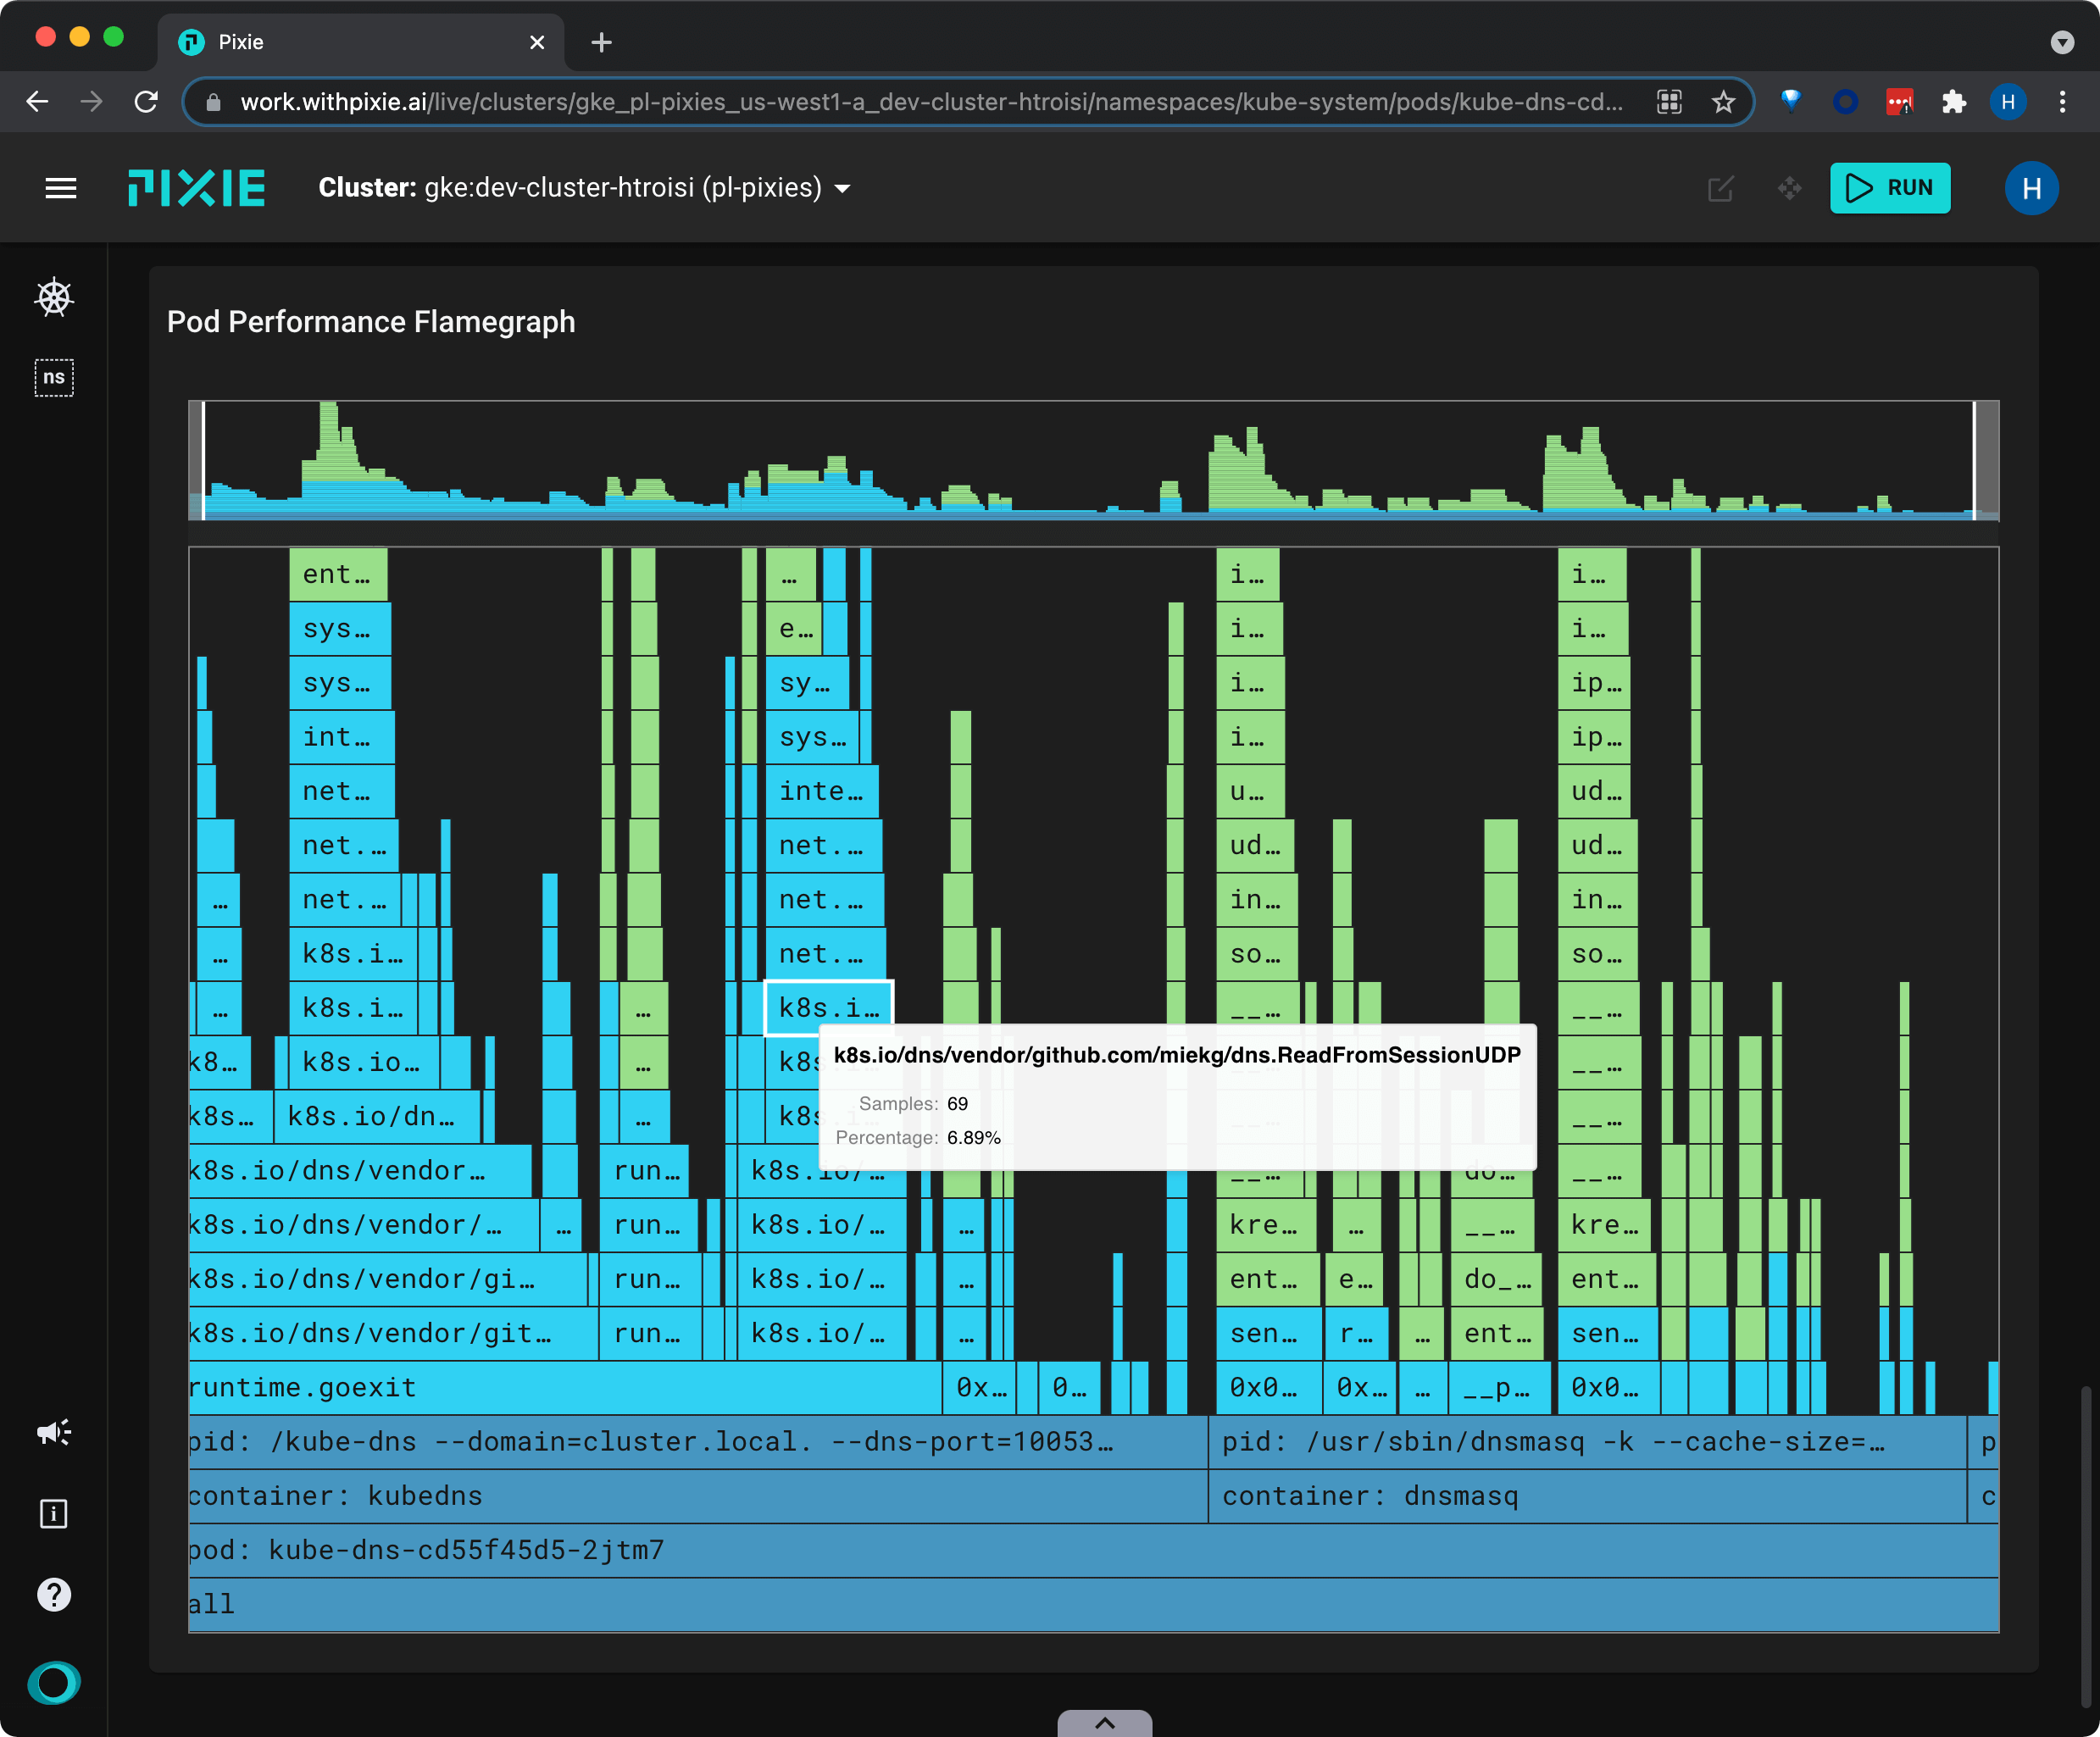
Scroll down to the bottom to see a CPU flamegraph for the pod.
This flamegraph can be used to identify performance issues in application code written in one of the supported languages (Go, C++, Rust). The wider the bar, the more time spent in the function.
Colors differentiate between K8s metadata (dark blue), user space app code (light blue), and kernel code (light green).
Scroll to zoom. Click + drag to pan the view. ctrl (Linux, Windows) / cmd (Mac) + click to center the view on the selected box.
Reset the zoom by clicking the bottom box.
To learn more about how use Pixie for application profiling, check out the Profiling with Flamegraphs tutorial.
Related Scripts
This tutorial demonstrated a few of Pixie's community scripts. For more insight into your infrastructure, check out the following scripts:
Resource usage by Kubernetes object
px/namespaces lists the namespaces on the cluster with their pod and service counts. It also lists the high-level resource consumption by namespace.
px/namespace lists the pods and services in a given namespace, as well as a service map.
px/pods shows an overview of the pods in the specified namespace along with their high-level application metrics (latency, error, throughput) and resource usage (cpu, writes, reads).
Memory usage
px/pid_memory_usage shows the virtual and average memory useage for all processes in the cluster.
px/service_memory_usage shows the virtual and average memory useage for all services in the cluster.
px/perf_flamegraph shows stack trace samples that indicate where your applications are spending their time. Optional filters refine the results by namespace, node or pod.
px/upids shows a list of UPIDs running in the specified namespace.
px/jvm_stats shows JVM stats for Java processes running on the cluster.