The move from monolith to microservice architecture has greatly increased the volume of inter-service traffic. Pixie makes debugging this communication between services easy by providing immediate and deep (full-body) visibility into requests flowing through your cluster.
HTTP requests are featured in this tutorial, but Pixie can trace a number of different protocols including DNS, PostgreSQL, and MySQL. See the full list here.
This tutorial will demonstrate how to use Pixie to:
Inspect full-body HTTP requests.
See HTTP error rate per service.
See HTTP error rate per pod.
If you're interested in troubleshooting HTTP latency, check out the Service Performance tutorial.
Prerequisites
You will need a Kubernetes cluster with Pixie installed. If you do not have a cluster, you can create a minikube cluster and install Pixie using one of our install guides.
You will need to install the demo microservices application, using Pixie's CLI:
Run px demo deploy px-sock-shop to install Weavework's Sock Shop demo app.
Run kubectl get pods -n px-sock-shop to make sure all pods are ready before proceeding. The demo app can take up to 5 minutes to deploy.
Full-Body HTTP Request
A developer has noticed that the demo application's cart service is reporting errors.
To see high-level error rates for all of the services in your cluster, check out the Service Graph section of the Service Performance tutorial.
Let's use Pixie to look at HTTP requests with specific types of errors:
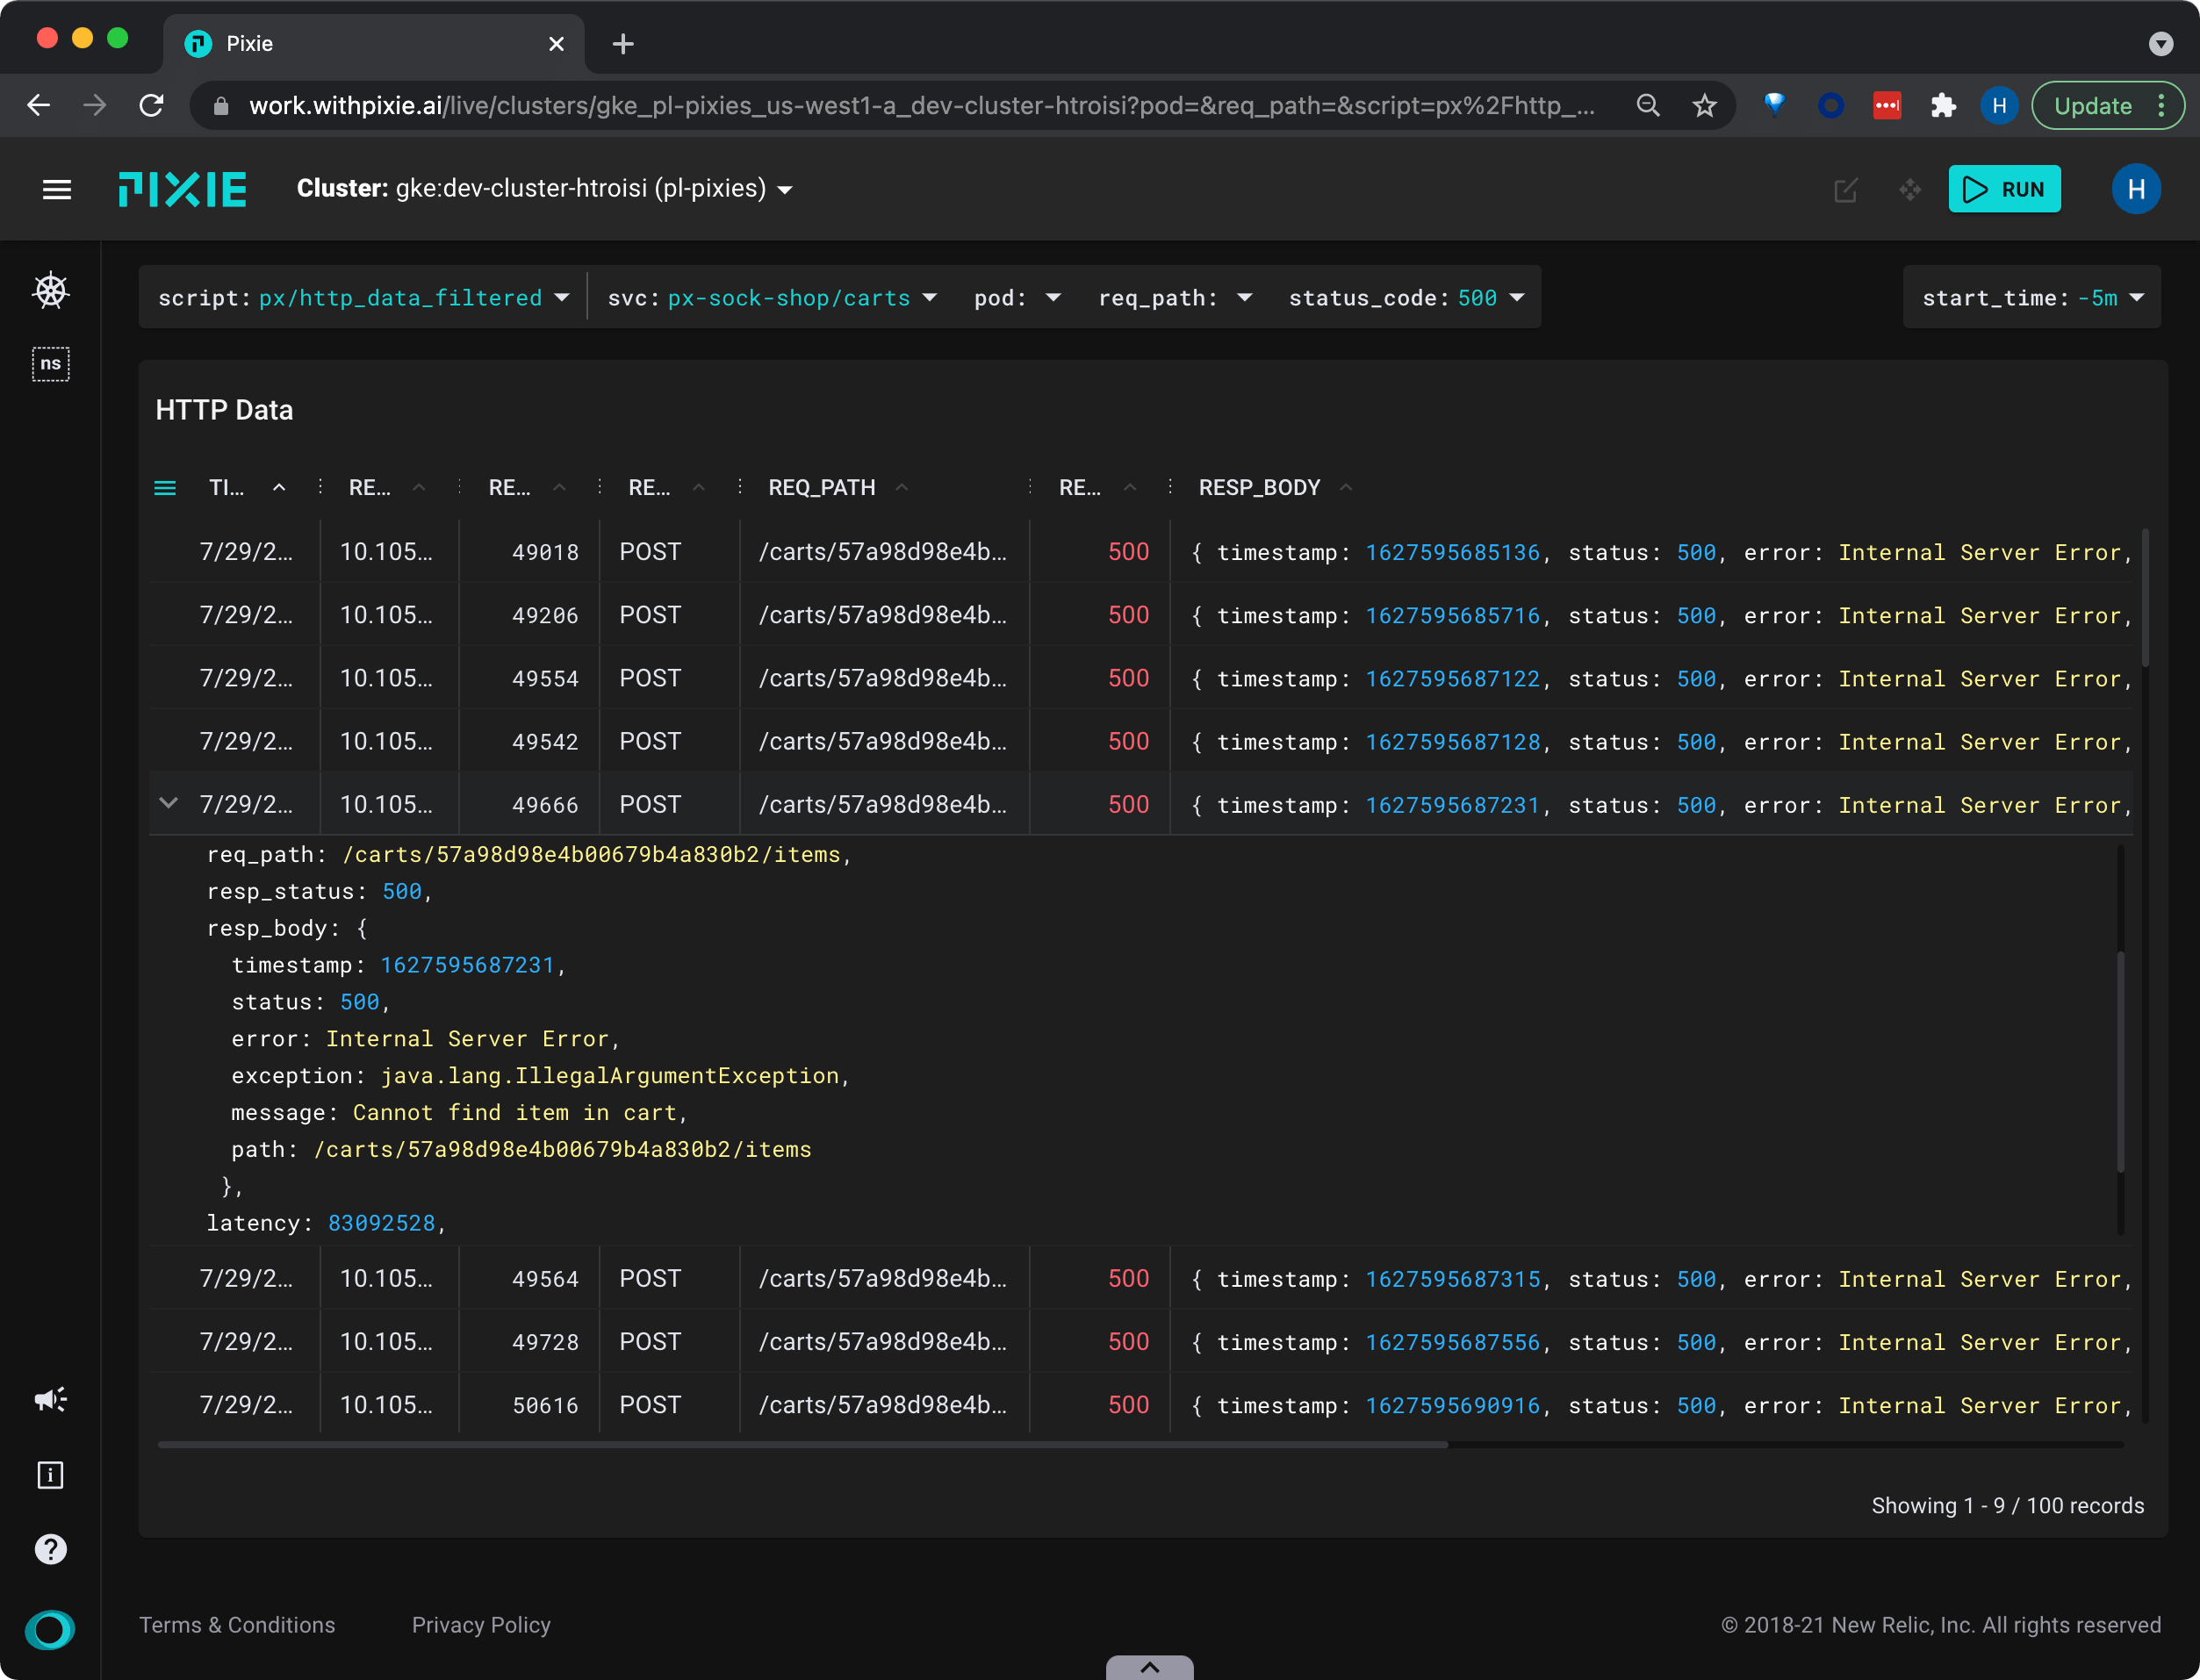
Select px/http_data_filtered from the script drop-down menu.
This script shows the most recent HTTP requests in your cluster filtered by service, pod, request path, and response status code.
Select the drop-down arrow next to the status_code argument, type 500, and press Enter to re-run the script.
This filters the HTTP requests to just those with the 500 status code.
Select the drop-down arrow next to the svc argument, type px-sock-shop/carts, and press Enter to re-run the script.
Pixie displays service names in the UI in the <namespace>/<service> format.
This filters the HTTP requests to just those made to the carts service.
Click a row to see the data in JSON form.
Show / hide table columns with the table column menu.
For requests with longer message bodies, it's often easier to view the data in JSON form.
Click on a table row to see the row data in JSON format.
Scroll through the JSON data to find the resp_body key.
We can see that a HTTP POST request to the carts service has returned an error, with the message: Cannot find item in cart.
Service Errors
Once we have identified a specific error coming from the carts service, we will want to go up a level to see how often these errors occur at the service level.
Hover over the HTTP Data table and scroll all the way to the right side.
Pixie's UI makes it easy to quickly navigate between Kubernetes resources. Clicking on any pod, node, service, or namespace name in the UI will open a script showing a high-level overview for that entity.
From the SVC column, click on the px-sock-shop/carts service name.
This will open the px/service script with the service argument pre-filled with the name of the service you selected.
The px/service script shows error rate over time for all inbound HTTP requests.
Modify the start_time to change the time window for the results (e.g -30m, -1h).
We can see that the carts service has had a low but consistent error rate over the selected time window.
Scroll down to the Inbound Traffic by Requesting Service table.
This table shows the services making requests to the carts service.
We can see from the ERROR_RATE column that the requests with errors are only coming from the front-end service.
Pod Errors
If services are backed by multiple pods, it is worth inspecting the individual pods to see if a single pod is the source of the service's errors.
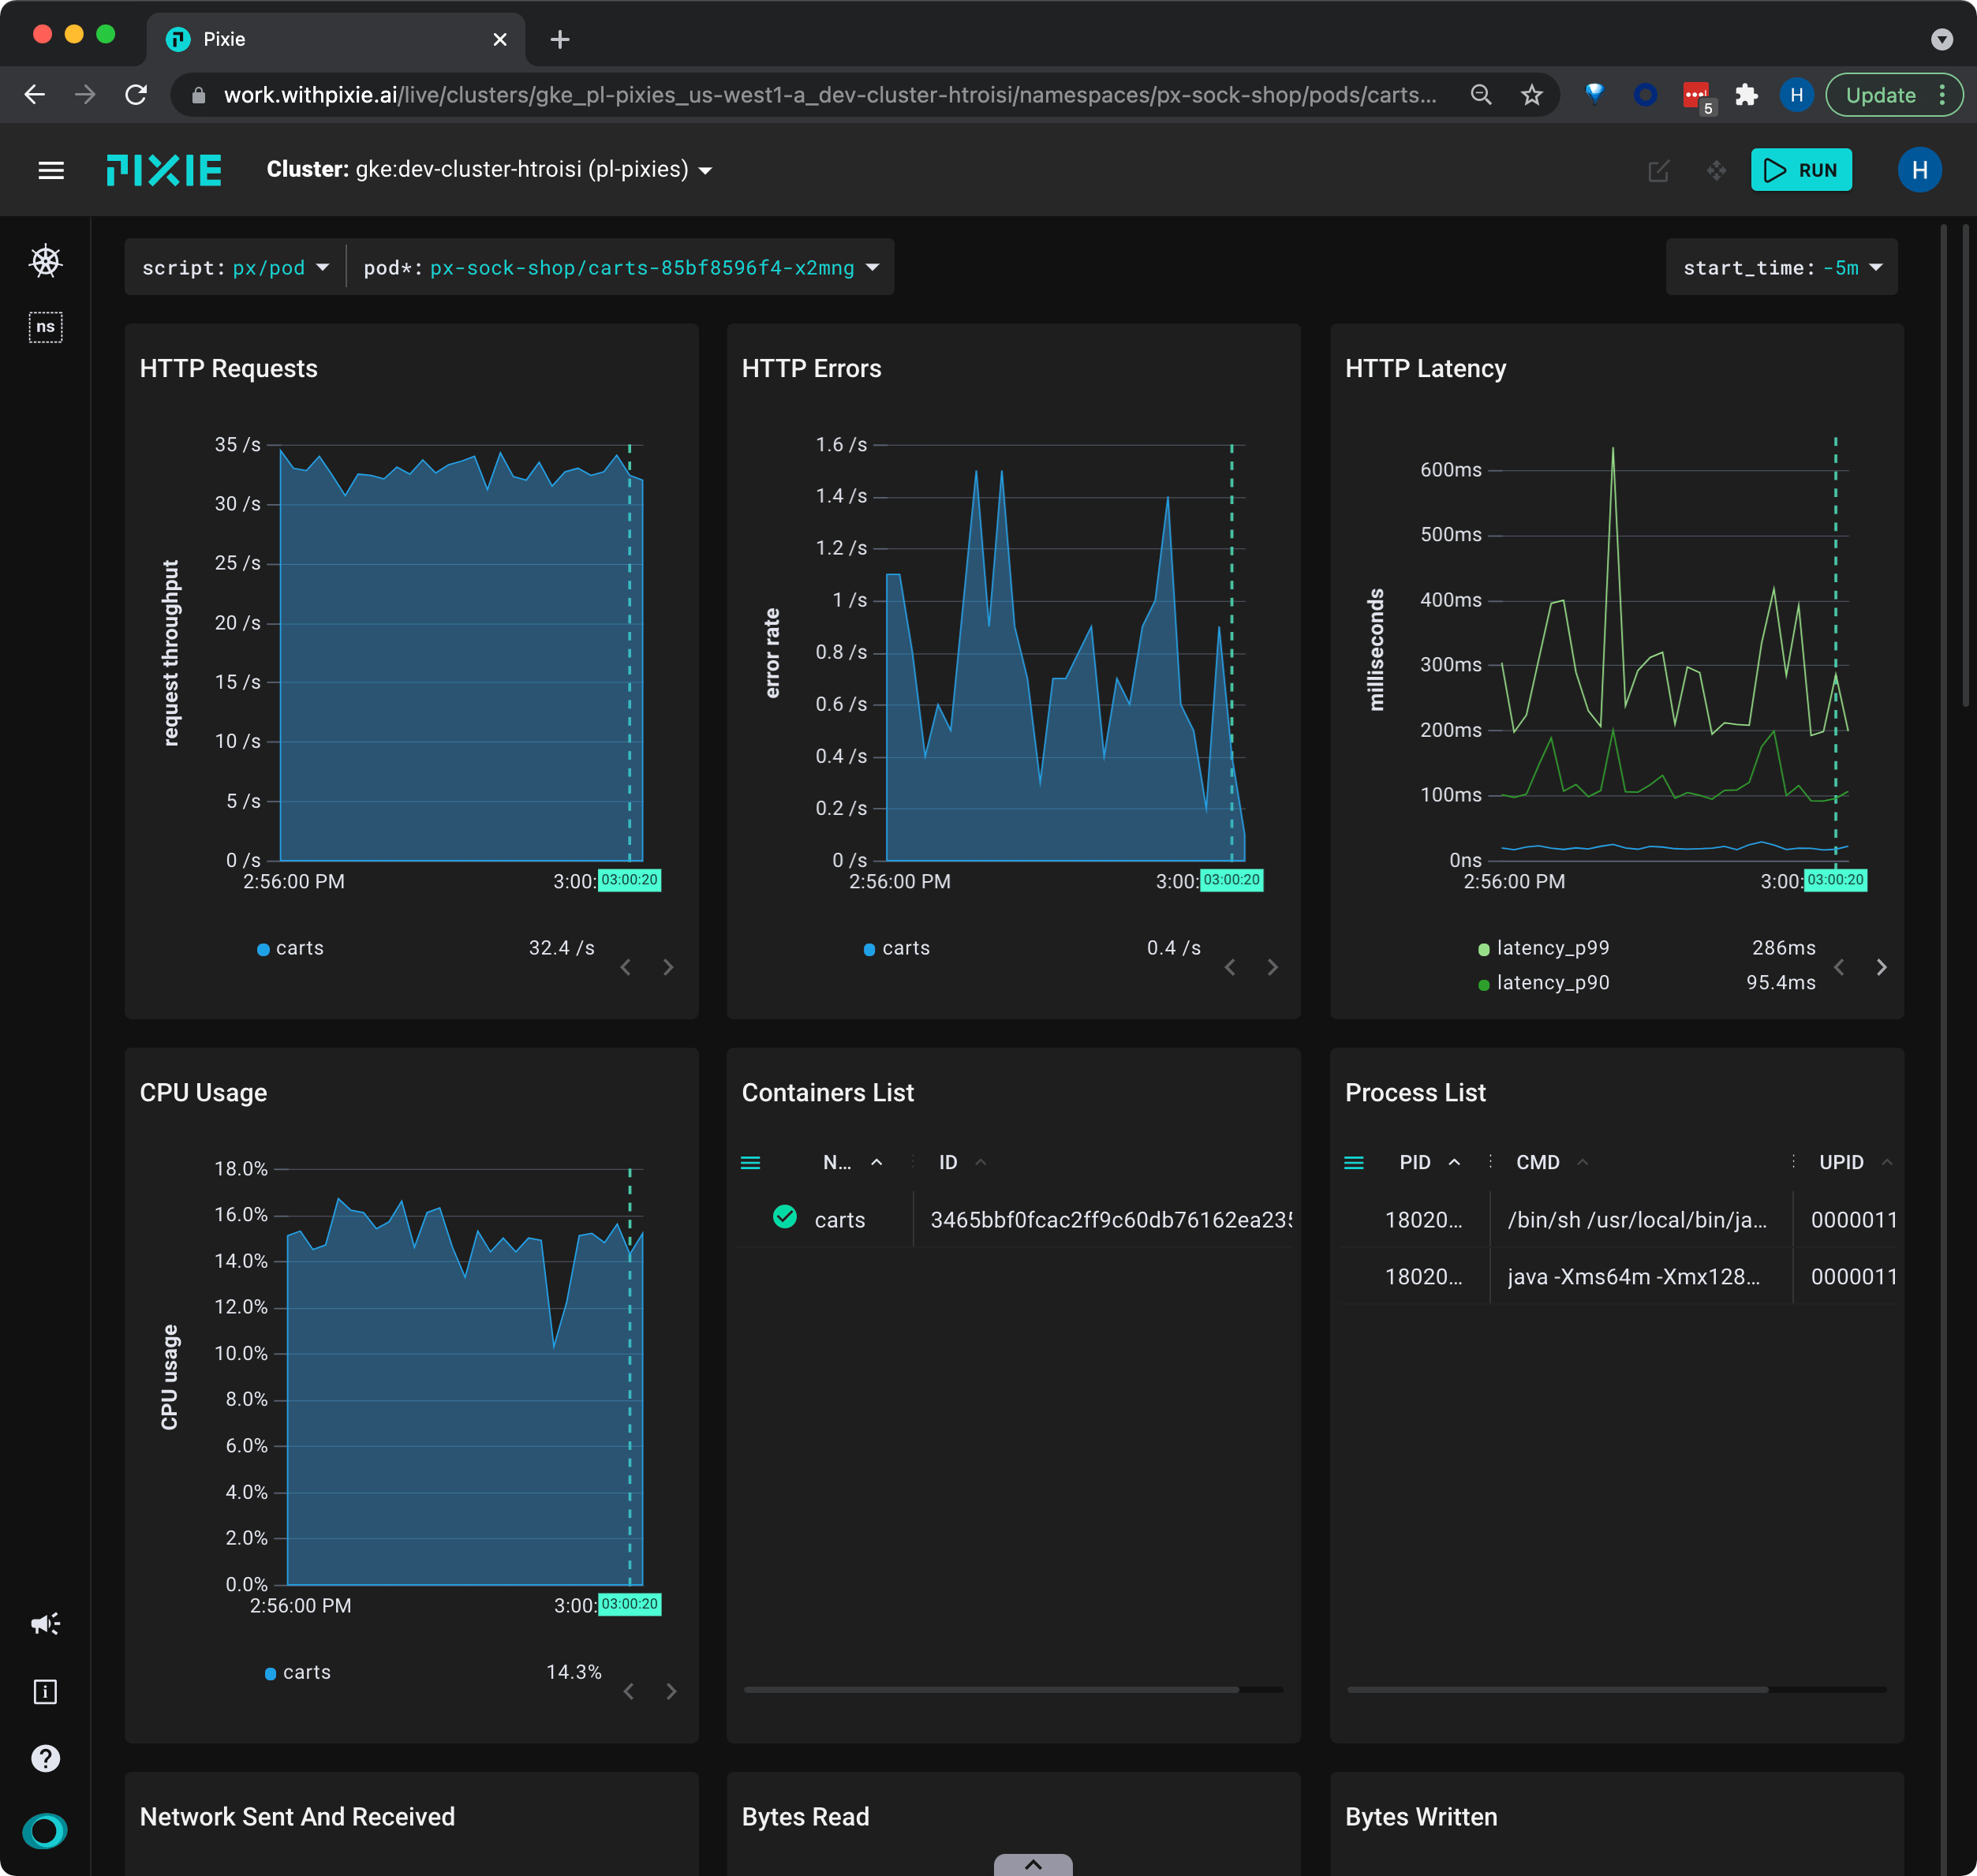
Scroll up to the Pod List table.
In this case, the carts service is backed by a single pod. If the service had multiple pods, they would be listed here.
Click on the pod name in the Pod List table.
This will open the px/pod script with the pod argument pre-filled with the name of the pod you selected.
We can see that there is no resource pressure on this pod and that the HTTP request throughput has been constant over the selected time window.
Resolving this bug requires further insight into the application logic. For Go/C/C++ applications, you might want to try Pixie's continuous profiling feature. Pixie also offers dynamic logging for Go applications.
Related Scripts
This tutorial demonstrated a few of Pixie's community scripts. To see full body requests for a specific protocol, check out the following scripts:
px/http_data shows the most recent HTTP/2 requests in the cluster.
px/dns_data shows the most recent DNS requests in the cluster.
px/mysql_data shows the most recent MySQL requests in the cluster.
px/pgsql_data shows the most recent Postgres requests in the cluster.
px/redis_data shows the most recent Redis requests in the cluster.
px/cql_data shows the most recent Cassandra requests in the cluster.